UNITED STATES
SECURITIES AND EXCHANGE COMMISSION
WASHINGTON, D.C. 20549
FORM 10-Q
(Mark one)
|
|
|
|
|
☑
|
|
QUARTERLY REPORT PURSUANT TO SECTION 13 OR 15(d) OF THE SECURITIES
EXCHANGE ACT OF 1934
|
For the quarterly period ended September 30, 2019
OR
|
|
|
|
|
☐
|
|
TRANSITION REPORT PURSUANT TO SECTION 13 OR 15(d) OF THE SECURITIES
EXCHANGE ACT OF 1934
|
For the transition period from _________to _________
Commission File Number 0-1665
KINGSTONE COMPANIES, INC.
(Exact name of registrant as specified in its charter)
|
|
|
|
|
Delaware(State or other jurisdiction of incorporation or
organization)
|
|
36-2476480(I.R.S. EmployerIdentification Number)
|
15 Joys Lane
Kingston, NY 12401
(Address of principal executive offices)
(845) 802-7900
(Registrant’s telephone number, including area
code)
Securities
registered pursuant to Section 12(b) of the Act:
|
Title
of each class
|
Trading
Symbol(s)
|
Name of
each exchange on which registered
|
|
Common
Stock, $0.01 par value per share
|
KINS
|
Nasdaq Capital Market
|
Indicate
by check mark whether the registrant (1) has filed all reports
required to be filed by Section 13 or 15(d) of the Securities
Exchange Act of 1934 during the preceding 12 months (or for
such shorter period that the registrant was required to file such
reports), and (2) has been subject to such filing requirements
for the past 90 days.
Yes ☑ No ☐
Indicate
by check mark whether the registrant has submitted electronically
every Interactive Data File required to be submitted pursuant to
Rule 405 of Regulation S-T (§ 232.405 of this chapter) during
the preceding 12 months (or for such shorter period that the
registrant was required to submit such files).
Yes ☑ No ☐
Indicate
by check mark whether the registrant is a large accelerated filer,
an accelerated filer, a non-accelerated filer or a smaller
reporting company. See the definitions of “large accelerated
filer”, “accelerated filer”, and “smaller
reporting company” in Rule 12b-2 of the Exchange Act. (Check
one):
|
Large accelerated filer
|
|
☐
|
Accelerated filer
|
|
☑
|
|
Non-accelerated filer
|
|
☐
|
Smaller reporting company
|
|
☑
|
|
|
|
|
Emerging growth company
|
|
☐
|
If an emerging growth company, indicate by check mark if the
registrant has elected not to use the extended transition period
for complying with any new or revised financial accounting
standards provided pursuant to Section 13(a) of the Exchange
Act. ☐
Indicate
by check mark whether the registrant is a shell company (as defined
in Rule 12b-2 of the Exchange Act).
Yes ☐ No ☑
As of
November 12, 2019, there were 10,785,069 shares of the
registrant’s common stock outstanding.
KINGSTONE COMPANIES, INC.
INDEX
|
|
|
|
|
|
|
PAGE
|
|
|
|
|
|
2
|
||
|
Item 1 —
|
Financial
Statements
|
2
|
|
|
Condensed
Consolidated Balance Sheets at September 30, 2019 (Unaudited) and
December 31, 2018
|
2
|
|
|
Condensed
Consolidated Statements of Operations and Comprehensive Income
(Loss) for the three months and nine months ended September 30,
2019 (Unaudited) and 2018 (Unaudited)
|
3
|
|
|
Condensed
Consolidated Statements of Stockholders’ Equity for the three
months and nine months ended September 30, 2019 (Unaudited) and
2018 (Unaudited)
|
4
|
|
|
Condensed
Consolidated Statements of Cash Flows for the nine months ended
September 30, 2019 (Unaudited) and 2018 (Unaudited)
|
7
|
|
|
Notes
to Condensed Consolidated Financial Statements
(Unaudited)
|
8
|
|
Item 2 —
|
Management’s
Discussion and Analysis of Financial Condition and Results of
Operations
|
37
|
|
Item 3 —
|
Quantitative
and Qualitative Disclosures About Market Risk
|
66
|
|
Item 4 —
|
Controls
and Procedures
|
66
|
|
|
|
|
|
67
|
||
|
Item 1 —
|
Legal
Proceedings
|
67
|
|
Item 1A —
|
Risk
Factors
|
67
|
|
Item 2 —
|
Unregistered
Sales of Equity Securities and Use of Proceeds
|
67
|
|
Item 3 —
|
Defaults
Upon Senior Securities
|
67
|
|
Item 4 —
|
Mine
Safety Disclosures
|
67
|
|
Item 5 —
|
Other
Information
|
67
|
|
Item 6 —
|
Exhibits
|
67
|
|
Signatures
|
|
|
Forward-Looking Statements
This
Quarterly Report contains forward-looking statements within the
meaning of the Private Securities Litigation Reform Act of 1995.
The events described in forward-looking statements contained in
this Quarterly Report may not occur. Generally, these statements
relate to business plans or strategies, projected or anticipated
results or other consequences of our plans or strategies, projected
or anticipated results from acquisitions to be made by us, or
projections involving anticipated revenues, earnings, costs or
other aspects of our operating results. The words
“may,” “will,” “expect,”
“believe,” “anticipate,”
“project,” “plan,” “intend,”
“estimate,” and “continue,” and their
opposites and similar expressions are intended to identify
forward-looking statements. We caution you that these statements
are not guarantees of future performance or events and are subject
to a number of uncertainties, risks and other influences, many of
which are beyond our control, which may influence the accuracy of
the statements and the projections upon which the statements are
based. Factors which may cause actual results and outcomes to
differ materially from those contained in the forward-looking
statements include, but are not limited to the risks and
uncertainties discussed in Part I Item 1A of our Annual Report on
Form 10-K for the year ended December 31, 2018.
Any one
or more of these uncertainties, risks and other influences could
materially affect our results of operations and whether
forward-looking statements made by us ultimately prove to be
accurate. Our actual results, performance and achievements could
differ materially from those expressed or implied in these
forward-looking statements. We undertake no obligation to publicly
update or revise any forward-looking statements, whether from new
information, future events or otherwise except as required by
law.
PART I. FINANCIAL
INFORMATION
Item
1.
Financial
Statements.
|
KINGSTONE COMPANIES, INC. AND
SUBSIDIARIES
|
||
|
Condensed Consolidated Balance Sheets
|
||
|
|
September
30,
|
December
31,
|
|
|
2019
|
2018
|
|
|
(unaudited)
|
|
|
Assets
|
|
|
|
Fixed-maturity
securities, held-to-maturity, at amortized cost (fair value
of
|
|
|
|
$4,127,384
at September 30, 2019 and $4,426,416 at December 31,
2018)
|
$3,825,505
|
$4,222,855
|
|
Fixed-maturity securities, available-for-sale, at fair value
(amortized cost of
|
|
|
|
$160,601,004
at September 30, 2019 and $155,431,261 at December 31,
2018)
|
166,220,711
|
151,777,516
|
|
Equity securities, at fair value (cost of $22,070,565 at September
30, 2019 and
|
|
|
|
$18,305,986
at December 31, 2018)
|
23,499,199
|
16,572,616
|
|
Other
investments
|
2,425,904
|
1,855,225
|
|
Total
investments
|
195,971,319
|
174,428,212
|
|
Cash
and cash equivalents
|
25,639,050
|
21,138,403
|
|
Premiums
receivable, net
|
14,352,521
|
13,961,599
|
|
Reinsurance
receivables, net
|
26,580,449
|
26,367,115
|
|
Deferred
policy acquisition costs
|
20,491,568
|
17,907,737
|
|
Intangible
assets, net
|
500,000
|
670,000
|
|
Property
and equipment, net
|
7,582,210
|
6,056,929
|
|
Deferred
income taxes, net
|
540,295
|
354,233
|
|
Other
assets
|
6,762,909
|
5,867,850
|
|
Total assets
|
$298,420,321
|
$266,752,078
|
|
|
|
|
|
Liabilities
|
|
|
|
Loss
and loss adjustment expense reserves
|
$77,409,423
|
$56,197,106
|
|
Unearned
premiums
|
90,068,683
|
79,032,131
|
|
Advance
premiums
|
3,737,491
|
2,107,629
|
|
Reinsurance
balances payable
|
809,836
|
1,933,376
|
|
Deferred
ceding commission revenue
|
1,828,872
|
2,686,677
|
|
Accounts
payable, accrued expenses and other liabilities
|
8,403,012
|
6,819,231
|
|
Income
taxes payable
|
-
|
15,035
|
|
Long-term
debt, net
|
29,427,386
|
29,295,251
|
|
Total
liabilities
|
211,684,703
|
178,086,436
|
|
|
|
|
|
Commitments and Contingencies (Note 11)
|
|
|
|
|
|
|
|
Stockholders' Equity
|
|
|
|
Preferred
stock, $.01 par value; authorized 2,500,000 shares
|
-
|
-
|
|
Common
stock, $.01 par value; authorized 20,000,000 shares; issued
11,811,011 shares
|
||
|
at
September 30, 2019 and 11,775,148 at December 31, 2018;
outstanding
|
|
|
|
10,783,572
shares at September 30, 2019 and 10,747,709 shares at December 31,
2018
|
118,110
|
117,751
|
|
Capital
in excess of par
|
68,755,776
|
67,763,940
|
|
Accumulated
other comprehensive income (loss)
|
4,441,716
|
(2,884,313)
|
|
Retained
earnings
|
16,132,568
|
26,380,816
|
|
|
89,448,170
|
91,378,194
|
|
Treasury
stock, at cost, 1,027,439 shares at September 30, 2019
|
|
|
|
and
at December 31, 2018
|
(2,712,552)
|
(2,712,552)
|
|
Total stockholders' equity
|
86,735,618
|
88,665,642
|
|
|
|
|
|
Total liabilities and stockholders' equity
|
$298,420,321
|
$266,752,078
|
____________________________________________________________________________________________________
See accompanying notes to condensed consolidated financial
statements.
2
|
KINGSTONE COMPANIES, INC. AND SUBSIDIARIES
|
||||
|
|
|
|
|
|
|
Condensed Consolidated Statements of Operations and Comprehensive
Income (Loss) (Unaudited)
|
||||
|
|
For the
Three Months Ended
|
For the
Nine Months Ended
|
||
|
|
September
30,
|
September
30,
|
||
|
|
2019
|
2018
|
2019
|
2018
|
|
|
|
|
|
|
|
Revenues
|
|
|
|
|
|
Net
premiums earned
|
$34,220,010
|
$27,533,907
|
$95,017,178
|
$74,476,138
|
|
Ceding
commission revenue
|
1,029,582
|
1,044,529
|
2,982,960
|
4,430,855
|
|
Net
investment income
|
1,856,553
|
1,602,371
|
5,200,034
|
4,543,226
|
|
Net
gains (losses) on investments
|
998,162
|
352,025
|
3,712,180
|
(277,835)
|
|
Other
income
|
495,696
|
353,077
|
1,191,569
|
961,581
|
|
Total
revenues
|
38,600,003
|
30,885,909
|
108,103,921
|
84,133,965
|
|
|
|
|
|
|
|
Expenses
|
|
|
|
|
|
Loss
and loss adjustment expenses
|
24,781,318
|
13,296,708
|
71,587,850
|
41,739,123
|
|
Commission
expense
|
7,779,344
|
6,594,323
|
21,931,933
|
18,411,460
|
|
Other
underwriting expenses
|
6,430,734
|
5,193,679
|
17,983,174
|
15,301,168
|
|
Other
operating expenses
|
705,710
|
683,309
|
2,774,350
|
1,773,983
|
|
Depreciation
and amortization
|
646,201
|
440,383
|
1,876,202
|
1,273,975
|
|
Interest
expense
|
456,545
|
456,545
|
1,369,635
|
1,365,052
|
|
Total
expenses
|
40,799,852
|
26,664,947
|
117,523,144
|
79,864,761
|
|
|
|
|
|
|
|
(Loss)
income before taxes
|
(2,199,849)
|
4,220,962
|
(9,419,223)
|
4,269,204
|
|
Income
tax (benefit) expense
|
(474,687)
|
287,232
|
(1,998,251)
|
296,111
|
|
Net (loss) income
|
(1,725,162)
|
3,933,730
|
(7,420,972)
|
3,973,093
|
|
|
|
|
|
|
|
Other comprehensive income (loss), net of tax
|
|
|
||
|
Gross change in unrealized gains (losses)
|
|
|
|
|
|
on
available-for-sale-securities
|
1,323,626
|
(242,453)
|
9,191,817
|
(4,591,699)
|
|
|
|
|
|
|
|
Reclassification adjustment for losses
|
|
|
|
|
|
included
in net income
|
46,841
|
131,978
|
81,636
|
451,877
|
|
Net change in unrealized gains (losses)
|
1,370,467
|
(110,475)
|
9,273,453
|
(4,139,822)
|
|
Income tax (expense) benefit related to
items
|
|
|
||
|
of
other comprehensive income (loss)
|
(287,798)
|
12,416
|
(1,947,424)
|
858,377
|
|
Other comprehensive income (loss), net of tax
|
1,082,669
|
(98,059)
|
7,326,029
|
(3,281,445)
|
|
|
|
|
|
|
|
Comprehensive (loss) income
|
$(642,493)
|
$3,835,671
|
$(94,943)
|
$691,648
|
|
|
|
|
|
|
|
(Loss) Earnings per common share:
|
|
|
|
|
|
Basic
|
$(0.16)
|
$0.37
|
$(0.69)
|
$0.37
|
|
Diluted
|
$(0.16)
|
$0.36
|
$(0.69)
|
$0.37
|
|
|
|
|
|
|
|
Weighted average common shares outstanding
|
|
|
||
|
Basic
|
10,779,641
|
10,681,329
|
10,769,817
|
10,672,084
|
|
Diluted
|
10,779,641
|
10,791,123
|
10,769,817
|
10,780,590
|
|
|
|
|
|
|
|
Dividends declared and paid per common share
|
$0.0625
|
$0.1000
|
$0.2625
|
$0.3000
|
____________________________________________________________________________________________________
See accompanying notes to condensed consolidated financial
statements.
3
|
KINGSTONE COMPANIES, INC. AND SUBSIDIARIES
|
||||||||||
|
|
|
|
|
|
|
|
|
|
|
|
|
Condensed Consolidated Statements of Stockholders' Equity
(Unaudited)
|
||||||||||
|
Three months ended September 30, 2019 and 2018
|
||||||||||
|
|
|
|
|
|
|
Accumulated
|
|
|
|
|
|
|
|
|
|
|
Capital
|
Other
|
|
|
|
|
|
|
Preferred Stock
|
Common Stock
|
in Excess
|
Comprehensive
|
Retained
|
Treasury Stock
|
|
|||
|
|
Shares
|
Amount
|
Shares
|
Amount
|
of Par
|
Loss
|
Earnings
|
Shares
|
Amount
|
Total
|
|
Balance, July 1,
2018
|
-
|
$-
|
11,685,904
|
$116,859
|
$68,347,784
|
$(2,496,981)
|
$25,471,668
|
1,024,444
|
$(2,712,522)
|
$88,726,808
|
|
Stock-based
compensation
|
-
|
-
|
-
|
-
|
197,335
|
-
|
-
|
-
|
-
|
197,335
|
|
Vesting of restricted
stock awards
|
-
|
-
|
4,866
|
48
|
(48)
|
-
|
-
|
-
|
-
|
-
|
|
Share deducted from
restricted stock awards for payment of withholding
taxes
|
-
|
-
|
(1,059)
|
(11)
|
(18,339)
|
-
|
-
|
-
|
-
|
(18,350)
|
|
Exercise of stock
options
|
-
|
-
|
57,596
|
576
|
26,684
|
-
|
-
|
-
|
-
|
27,260
|
|
Shares deducted from
exercise of stock
|
-
|
-
|
(18,141)
|
(181)
|
(332,702)
|
-
|
-
|
-
|
-
|
(332,883)
|
|
Acquisition of treasury
stock
|
-
|
-
|
-
|
-
|
-
|
-
|
-
|
2,995
|
(30)
|
(30)
|
|
Dividends
|
-
|
-
|
-
|
-
|
-
|
-
|
(1,070,054)
|
-
|
-
|
(1,070,054)
|
|
Net
income
|
-
|
-
|
-
|
-
|
-
|
-
|
3,933,730
|
-
|
-
|
3,933,730
|
|
Change in unrealized
losses on available-for-sale securities, net of
tax
|
-
|
-
|
-
|
-
|
-
|
(98,059)
|
-
|
-
|
-
|
(98,059)
|
|
Balance, September 30,
2018
|
-
|
$-
|
11,729,166
|
$117,291
|
$68,220,714
|
$(2,595,040)
|
$28,335,344
|
1,027,439
|
$(2,712,552)
|
$91,365,757
|
|
|
|
|
|
|
|
Accumulated
|
|
|
|
|
|
|
|
|
|
|
Capital
|
Other
|
|
|
|
|
|
|
Preferred Stock
|
Common Stock
|
in Excess
|
Comprehensive
|
Retained
|
Treasury Stock
|
|
|||
|
|
Shares
|
Amount
|
Shares
|
Amount
|
of Par
|
Income
|
Earnings
|
Shares
|
Amount
|
Total
|
|
Balance, July 1,
2019
|
-
|
$-
|
11,802,087
|
$118,020
|
$68,373,590
|
$3,359,047
|
$18,531,657
|
1,027,439
|
$(2,712,552)
|
$87,669,762
|
|
Stock-based
compensation
|
-
|
-
|
-
|
-
|
407,714
|
-
|
-
|
-
|
-
|
407,714
|
|
Vesting of restricted
stock awards
|
-
|
-
|
12,050
|
120
|
(120)
|
-
|
-
|
-
|
-
|
-
|
|
Shares deducted from
restricted stock awards for payment of withholding
taxes
|
-
|
-
|
(3,126)
|
(30)
|
(25,408)
|
-
|
-
|
-
|
-
|
(25,438)
|
|
Dividends
|
-
|
-
|
-
|
-
|
-
|
-
|
(673,927)
|
-
|
-
|
(673,927)
|
|
Net
loss
|
-
|
-
|
-
|
-
|
-
|
-
|
(1,725,162)
|
-
|
-
|
(1,725,162)
|
|
Change in unrealized
gains on available-for-sale securities, net of
tax
|
-
|
-
|
-
|
-
|
-
|
1,082,669
|
-
|
-
|
-
|
1,082,669
|
|
Balance, September 30,
2019
|
-
|
$-
|
11,811,011
|
$118,110
|
$68,755,776
|
$4,441,716
|
$16,132,568
|
1,027,439
|
$(2,712,552)
|
$86,735,618
|
________________________________________________________________________________________________________________________________________
See accompanying notes to condensed consolidated financial
statements.
4
KINGSTONE COMPANIES, INC. AND
SUBSIDIARIES
|
Condensed Consolidated Statements of Stockholders' Equity
(Unaudited)
Nine months ended September 30, 2019 and 2018
|
|
|
Preferred Stock
|
Common Stock
|
Capital in
Excess
|
Accumulated Other Comprehensive
Income
|
Retained
|
Treasury Stock
|
|
|||
|
|
Shares
|
Amount
|
Shares
|
Amount
|
of Par
|
(Loss)
|
Earnings
|
Shares
|
Amount
|
Total
|
|
Balance, January 1,
2018, as reported
|
-
|
$-
|
11,618,646
|
$116,186
|
$68,380,390
|
$1,100,647
|
$27,152,822
|
986,809
|
$(2,172,299)
|
$94,577,746
|
|
Cumulative effect of
adoption of updated accounting guidance for equity financial
instruments at January 1, 2018
|
-
|
-
|
-
|
-
|
-
|
(414,242)
|
414,242
|
-
|
-
|
-
|
|
Balance, January 1,
2018, as adjusted
|
-
|
-
|
11,618,646
|
116,186
|
68,380,390
|
686,405
|
27,567,064
|
986,809
|
(2,172,299)
|
94,577,746
|
|
Stock-based
compensation
|
-
|
-
|
-
|
-
|
481,812
|
-
|
-
|
-
|
-
|
481,812
|
|
Exercise of stock
options
|
-
|
-
|
130,872
|
1,311
|
72,828
|
-
|
-
|
-
|
-
|
74,139
|
|
Shares deducted from
exercise of stock options for payment of withholding
taxes
|
-
|
-
|
(33,891)
|
(337)
|
(674,314)
|
-
|
-
|
-
|
-
|
(674,651)
|
|
Vesting of restricted
stock awards
|
-
|
-
|
15,752
|
155
|
(155)
|
-
|
-
|
-
|
-
|
-
|
|
Shares deducted from
restricted stock awards for payment of withholding
taxes
|
-
|
-
|
(2,213)
|
(24)
|
(39,847)
|
-
|
-
|
-
|
-
|
(39,871)
|
|
Acquisition of treasury
stock
|
-
|
-
|
-
|
-
|
-
|
-
|
-
|
40,630
|
(540,253)
|
(540,253)
|
|
Dividends
|
-
|
-
|
-
|
-
|
-
|
-
|
(3,204,813)
|
-
|
-
|
(3,204,813)
|
|
Net
income
|
-
|
-
|
-
|
-
|
-
|
-
|
3,973,093
|
-
|
-
|
3,973,093
|
|
Change in unrealized
losses on available-for-sale securities, net of
tax
|
-
|
-
|
-
|
-
|
-
|
(3,281,445)
|
-
|
-
|
-
|
(3,281,445)
|
|
Balance, September 30,
2018
|
-
|
$-
|
11,729,166
|
$117,291
|
$68,220,714
|
$(2,595,040)
|
$28,335,344
|
1,027,439
|
$(2,712,552)
|
$91,365,757
|
____________________________________________________________________________________________________________________________________________
See accompanying notes to condensed consolidated financial
statements.
5
KINGSTONE
COMPANIES, INC. AND SUBSIDIARIES
|
Condensed Consolidated Statements of Stockholders' Equity
(Unaudited)
|
||||||||||
|
Nine
months ended September 30, 2019 and 2018 Continued
|
||||||||||
|
|
|
|
|
|
|
|
|
|
|
|
|
|
|
|
|
|
|
|
|
|
|
|
|
|
Preferred Stock
|
Common Stock
|
Capital in
Excess
|
Accumulated Other Comprehensive
Income
|
Retained
|
Treasury Stock
|
|
|||
|
|
Shares
|
Amount
|
Shares
|
Amount
|
of Par
|
(Loss)
|
Earnings
|
Shares
|
Amount
|
Total
|
|
Balance, January 1,
2019
|
-
|
$-
|
11,775,148
|
$117,751
|
$67,763,940
|
$(2,884,313)
|
$26,380,816
|
1,027,439
|
$(2,712,552)
|
$88,665,642
|
|
Stock-based
compensation
|
-
|
-
|
-
|
-
|
1,116,921
|
-
|
-
|
-
|
-
|
1,116,921
|
|
Exercise of stock
options
|
-
|
-
|
3,000
|
30
|
23,522
|
-
|
-
|
-
|
-
|
23,552
|
|
Vesting of restricted
stock awards
|
-
|
-
|
43,596
|
434
|
(434)
|
-
|
-
|
-
|
-
|
-
|
|
Shares
deducted from restricted stock awards for payment of
withholding taxes
|
-
|
-
|
(10,733)
|
(105)
|
(148,173)
|
-
|
-
|
-
|
-
|
(148,278)
|
|
Dividends
|
-
|
-
|
-
|
-
|
-
|
-
|
(2,827,276)
|
-
|
-
|
(2,827,276)
|
|
Net
loss
|
-
|
-
|
-
|
-
|
-
|
-
|
(7,420,972)
|
-
|
-
|
(7,420,972)
|
|
Change
in unrealized gains on available-for-sale securities,
net of tax
|
-
|
-
|
-
|
-
|
-
|
7,326,029
|
-
|
-
|
-
|
7,326,029
|
|
Balance, September 30,
2019
|
-
|
$-
|
11,811,011
|
$118,110
|
$68,755,776
|
$4,441,716
|
$16,132,568
|
1,027,439
|
$(2,712,552)
|
$86,735,618
|
_______________________________________________________________________________
See accompanying notes to condensed consolidated financial
statements.
6
|
KINGSTONE COMPANIES, INC. AND SUBSIDIARIES
|
||
|
|
|
|
|
Condensed Consolidated Statements of Cash Flows (Unaudited)
|
||
|
Nine months ended September 30,
|
2019
|
2018
|
|
|
|
|
|
Cash flows from operating
activities:
|
|
|
|
Net
(loss) income
|
$(7,420,972)
|
$3,973,093
|
|
Adjustments
to reconcile net (loss) income to net cash flows provided by
operating activities:
|
||
|
Net
losses on sale of investments
|
54,759
|
377,303
|
|
Net
unrealized (gains) losses of equity investments
|
(3,196,260)
|
141,976
|
|
Net
unrealized gains of other investments
|
(570,679)
|
(241,444)
|
|
Depreciation
and amortization
|
1,876,202
|
1,273,975
|
|
Amortization
of bond premium, net
|
283,620
|
284,204
|
|
Amortization
of discount and issuance costs on long-term debt
|
132,135
|
124,241
|
|
Stock-based
compensation
|
1,116,921
|
481,812
|
|
Deferred
income tax (benefit) expense
|
(2,133,486)
|
136,032
|
|
(Increase)
decrease in operating assets:
|
|
|
|
Premiums
receivable, net
|
(390,922)
|
(266,849)
|
|
Reinsurance
receivables, net
|
(213,334)
|
3,500,669
|
|
Deferred
policy acquisition costs
|
(2,583,831)
|
(2,276,012)
|
|
Other
assets
|
(882,320)
|
(1,824,401)
|
|
Increase
(decrease) in operating liabilities:
|
|
|
|
Loss
and loss adjustment expense reserves
|
21,212,317
|
5,143,335
|
|
Unearned
premiums
|
11,036,552
|
9,926,741
|
|
Advance
premiums
|
1,629,862
|
1,411,027
|
|
Reinsurance
balances payable
|
(1,123,540)
|
(840,122)
|
|
Deferred
ceding commission revenue
|
(857,805)
|
(1,748,944)
|
|
Accounts
payable, accrued expenses and other liabilities
|
1,568,746
|
(1,379,309)
|
|
Net cash flows provided by operating activities
|
19,537,965
|
18,197,327
|
|
|
|
|
|
Cash flows from investing
activities:
|
|
|
|
Purchase
- fixed-maturity securities available-for-sale
|
(15,373,113)
|
(43,957,529)
|
|
Purchase
- equity securities
|
(6,657,676)
|
(10,357,210)
|
|
Sale
and redemption - fixed-maturity securities
held-to-maturity
|
400,000
|
624,963
|
|
Sale
or maturity - fixed-maturity securities
available-for-sale
|
9,835,464
|
17,740,260
|
|
Sale
- equity securities
|
2,941,492
|
5,694,121
|
|
Acquisition
of property and equipment
|
(3,231,483)
|
(2,044,440)
|
|
Net cash flows used in
investing activities
|
(12,085,316)
|
(32,299,835)
|
|
|
|
|
|
Cash flows from financing
activities:
|
|
|
|
Proceeds
from exercise of stock options
|
23,552
|
74,139
|
|
Withholding
taxes paid on net exercise of stock options
|
-
|
(674,651)
|
|
Withholding
taxes paid on vested retricted stock awards
|
(148,278)
|
(39,871)
|
|
Purchase
of treasury stock
|
-
|
(540,253)
|
|
Dividends
paid
|
(2,827,276)
|
(3,204,813)
|
|
Net cash flows used in
financing activities
|
(2,952,002)
|
(4,385,449)
|
|
|
|
|
|
Increase
(decrease) in cash and cash equivalents
|
$4,500,647
|
$(18,487,957)
|
|
Cash
and cash equivalents, beginning of period
|
21,138,403
|
48,381,633
|
|
Cash and cash equivalents, end of period
|
$25,639,050
|
$29,893,676
|
|
|
|
|
|
Supplemental disclosures of cash flow
information:
|
|
|
|
Cash
paid for income taxes
|
$388,000
|
$1,250,000
|
|
Cash
paid for interest
|
$825,000
|
$875,417
|
_____________________________________________________________________________________
See accompanying notes to condensed consolidated financial
statements.
7
KINGSTONE COMPANIES, INC. AND SUBSIDIARIES
NOTES TO CONDENSED CONSOLIDATED FINANCIAL STATEMENTS
(Unaudited)
Note 1 - Nature of Business and Basis of Presentation
Kingstone
Companies, Inc. (referred to herein as "Kingstone" or the
“Company”), through its wholly owned subsidiary,
Kingstone Insurance Company (“KICO”), underwrites
property and casualty insurance to small businesses and individuals
exclusively through agents and brokers. KICO is a licensed
insurance company in the States of New York, New Jersey, Rhode
Island, Massachusetts, Pennsylvania, Connecticut, Maine and New
Hampshire. KICO is currently offering its property and casualty
insurance products in New York, New Jersey, Rhode Island,
Massachusetts, and Connecticut. Although New Jersey, Rhode Island,
Massachusetts and Connecticut continue to be growing markets for
the Company, 84.0% and 86.8% of KICO’s direct written
premiums for the three months and nine months ended September 30,
2019, respectively, came from the New York policies. Kingstone,
through its subsidiary, Cosi Agency, Inc. (“Cosi”), a
multi-state licensed general agency, accesses alternate forms of
distribution outside of the independent agent and broker network,
through which KICO currently distributes its various products.
Kingstone (through Cosi) now has the opportunity to partner with
name-brand carriers and access nationwide insurance
agencies.
The
accompanying unaudited condensed consolidated financial statements
have been prepared in accordance with U.S. generally accepted
accounting principles (“GAAP”). The principles for
condensed interim financial information do not require the
inclusion of all the information and footnotes required by GAAP for
complete financial statements. Therefore, these condensed
consolidated financial statements should be read in conjunction
with the consolidated financial statements as of and for the year
ended December 31, 2018 and notes thereto included in the
Company’s Annual Report on Form 10-K filed with the SEC on
March 18, 2019. The accompanying condensed consolidated financial
statements have not been audited by an independent registered
public accounting firm in accordance with standards of the Public
Company Accounting Oversight Board (United States) but, in the
opinion of management, such financial statements include all
adjustments, consisting only of normal recurring adjustments,
necessary for a fair statement of the Company’s financial
position and results of operations. The results of operations for
the nine months ended September 30,
2019 may not be indicative of the results that may be
expected for the year ending December 31, 2019.
Note 2 – Accounting Policies
Use of Estimates
The preparation of financial statements in conformity with GAAP
requires management to make estimates and assumptions that affect
the reported amounts of assets and liabilities and disclosure of
contingent assets and liabilities at the date of the consolidated
financial statements and the reported amounts of revenues and
expenses during the reporting period. Actual results could differ
from these estimates and assumptions, which include the reserves
for losses and loss adjustment expenses, and are subject to
estimation errors due to the inherent uncertainty in projecting
ultimate claim amounts that will be reported and settled over a
period of many years. In addition, estimates and assumptions
associated with receivables under reinsurance contracts related to
contingent ceding commission revenue require judgments by
management. On an on-going basis, management reevaluates its
assumptions and the methods for calculating these estimates. Actual
results may differ significantly from the estimates and assumptions
used in preparing the consolidated financial
statements.
Principles of Consolidation
The
accompanying condensed consolidated financial statements consist of
Kingstone and its wholly owned subsidiaries, including KICO and its
wholly owned subsidiaries, CMIC Properties, Inc.
(“Properties”) and 15 Joys Lane, LLC (“15 Joys
Lane”), which together own the land and building from which
KICO operates. All significant inter-company account balances and
transactions have been eliminated in consolidation.
Accounting Changes
In
August 2018, the SEC adopted the final rule under SEC Release
No. 33-10532, “Disclosure Update and
Simplification,” amending certain disclosure requirements
that were redundant, duplicative, overlapping, outdated or
superseded. In addition, the amendments expanded the disclosure
requirements on the analysis of stockholders' equity for interim
financial statements. Under the amendments, an analysis of changes
in each caption of stockholders' equity presented in the balance
sheet must be provided in a note or separate statement. The
analysis should present a reconciliation of the beginning balance
to the ending balance of each period for which a statement of
comprehensive income is required to be filed. This final rule was
effective on November 5, 2018. The Company adopted the provisions
of this Release effective January 1, 2019, and included the
required presentation of changes in stockholders’ equity for
the nine months ended September 30, 2019 and 2018.
In
February 2016, the FASB issued ASU 2016-02 – Leases (Topic
842) (“ASU 2016-02”). Under this ASU, the Company
recognized a right-of-use-asset and corresponding liability on the
balance sheet for all leases, except for leases covering a period
of fewer than 12 months. The liability has been measured at the
present value of the future minimum lease payments taking into
account renewal options if applicable plus initial incremental
direct costs such as commissions. The minimum payments are
discounted using the Company’s incremental borrowing rate.
The Company adopted ASU 2016-02 effective January 1, 2019 using the
cumulative effect adjustment transition method, which applies the
provision of the standard at the effective date without adjusting
the comparative periods presented. The adoption of the updated
guidance resulted in the Company recognizing a right-of-use asset
of $855,000 as part of other assets and a lease liability of
$855,000 as part of accounts payable, accrued expenses and other
liabilities in the condensed consolidated balance sheet. The
right-of-use asset is amortized as rent expense on a straight line
basis. The adoption of this ASU did not have a material effect on
the Company's results of operations or liquidity.
8
Accounting Pronouncements
In June
2016, the FASB issued ASU 2016-13 - Financial Instruments - Credit
Losses (Topic 326): Measurement of Credit Losses on Financial
Instruments (“ASU 2016-13”). The revised accounting
guidance requires the measurement of all expected credit losses for
financial assets held at the reporting date based on historical
experience, current conditions, and reasonable and supportable
forecasts and requires enhanced disclosures related to the
significant estimates and judgments used in estimating credit
losses, as well as the credit quality and underwriting standards of
an organization’s portfolio. In addition, ASU 2016-13 amends
the accounting for credit losses of available-for-sale debt
securities and purchased financial assets with credit
deterioration. ASU 2016-13 will be effective for the Company on
January 1, 2020. The Company is currently evaluating the effect the
updated guidance will have on its consolidated financial
statements.
In
August 2018, the FASB issued ASU No. 2018-13, Fair Value
Measurement (Topic 820): Disclosure Framework - Changes to the
Disclosure Requirements for Fair Value Measurement (“ASU 2018-13”). This
update modifies the existing disclosure requirements on fair value
measurements in Topic 820 by changing requirements regarding Level
1, Level 2 and Level 3 investments. ASU 2018-13 is effective for
annual reporting periods beginning after December 15, 2019,
including interim periods within those annual periods, with early
adoption permitted. Entities are permitted to early adopt any
removed or modified disclosures of ASU 2018-13 immediately and
delay the adoption of the additional disclosures until their
effective date. The Company does not intend to early adopt the
additional disclosures and are assessing the impact of
retrospectively adopting the additions from this new accounting
standard on the fair value disclosures herein.
The
Company has determined that all other recently issued
accounting pronouncements will not have a material impact on its
consolidated financial position, results of operations and cash
flows, or do not apply to its operations.
Note 3 - Investments
Fixed-Maturity Securities
The amortized cost, estimated fair value, and unrealized gains and
losses of investments in fixed-maturity securities classified as
available-for-sale as of September 30, 2019 and December 31, 2018 are summarized as
follows:
|
|
September
30, 2019
|
|||||
|
|
|
|
|
|
|
Net
|
|
|
Cost
or
|
Gross
|
Gross
Unrealized Losses
|
Estimated
|
Unrealized
|
|
|
|
Amortized
|
Unrealized
|
Less
than 12
|
More
than 12
|
Fair
|
Gains/
|
|
Category
|
Cost
|
Gains
|
Months
|
Months
|
Value
|
(Losses)
|
|
|
|
|
|
|
|
|
|
Fixed-Maturity Securities:
|
|
|
|
|
|
|
|
U.S.
Treasury securities and
|
|
|
|
|
|
|
|
obligations
of U.S. government
|
|
|
|
|
|
|
|
corporations
and agencies
|
$8,243,486
|
$156,066
|
$-
|
$-
|
$8,399,552
|
$156,066
|
|
|
|
|
|
|
|
|
|
Political
subdivisions of States,
|
|
|
|
|
|
|
|
Territories
and Possessions
|
5,662,999
|
187,006
|
-
|
-
|
5,850,005
|
187,006
|
|
|
|
|
|
|
|
|
|
Corporate
and other bonds
|
|
|
|
|
|
|
|
Industrial
and miscellaneous
|
124,956,806
|
5,365,954
|
(33,073)
|
(20,893)
|
130,268,794
|
5,311,988
|
|
|
|
|
|
|
|
|
|
Residential
mortgage and other
|
|
|
|
|
|
|
|
asset
backed securities (1)
|
21,737,713
|
297,257
|
(19,924)
|
(312,685)
|
21,702,361
|
(35,352)
|
|
Total
|
$160,601,004
|
$6,006,283
|
$(52,997)
|
$(333,578)
|
$166,220,712
|
$5,619,708
|
(1)
In
2017, KICO placed certain residential mortgage backed securities as
eligible collateral in a designated custodian account related to
its membership in the Federal Home Loan Bank of New York ("FHLBNY")
(See Note 7). The eligible collateral would be pledged to FHLBNY if
KICO draws an advance from the FHLBNY credit line. As of September
30, 2019, the estimated fair value of the eligible investments was
approximately $5,144,000. KICO will retain all rights regarding all
securities if pledged as collateral. As of September 30, 2019,
there was no outstanding balance on the FHLBNY credit
line.
9
|
|
December
31, 2018
|
|||||
|
|
|
|
|
|
|
Net
|
|
|
Cost
or
|
Gross
|
Gross
Unrealized Losses
|
Estimated
|
Unrealized
|
|
|
|
Amortized
|
Unrealized
|
Less
than 12
|
More
than 12
|
Fair
|
Gains/
|
|
Category
|
Cost
|
Gains
|
Months
|
Months
|
Value
|
(Losses)
|
|
|
|
|
|
|
|
|
|
Fixed-Maturity Securities:
|
|
|
|
|
|
|
|
U.S.
Treasury securities and
|
|
|
|
|
|
|
|
obligations
of U.S. government
|
|
|
|
|
|
|
|
corporations
and agencies
|
$8,222,050
|
$26,331
|
$(28,000)
|
$-
|
$8,220,381
|
$(1,669)
|
|
|
|
|
|
|
|
|
|
Political
subdivisions of States,
|
|
|
|
|
|
|
|
Territories
and Possessions
|
6,339,540
|
50,903
|
(12,327)
|
(36,508)
|
6,341,608
|
2,068
|
|
|
|
|
|
|
|
|
|
Corporate
and other bonds
|
|
|
|
|
|
|
|
Industrial
and miscellaneous
|
119,078,698
|
123,740
|
(2,775,540)
|
(676,605)
|
115,750,293
|
(3,328,405)
|
|
|
|
|
|
|
|
|
|
Residential
mortgage and other
|
|
|
|
|
|
|
|
asset
backed securities (1)
|
21,790,973
|
236,502
|
(231,229)
|
(331,012)
|
21,465,234
|
(325,739)
|
|
Total
|
$155,431,261
|
$437,476
|
$(3,047,096)
|
$(1,044,125)
|
$151,777,516
|
$(3,653,745)
|
(1)
In
2017, KICO placed certain residential mortgage backed securities as
eligible collateral in a designated custodian account related to
its membership in the FHLBNY (see Note 7). The eligible collateral
would be pledged to FHLBNY if KICO draws an advance from the FHLBNY
credit line. As of December 31, 2018, the estimated fair value of
the eligible investments was approximately $5,116,000. KICO will
retain all rights regarding all securities if pledged as
collateral. As of December 31, 2018, there was no outstanding
balance on the FHLBNY credit line.
A summary of the amortized cost and estimated fair value of the
Company’s investments in available-for-sale fixed-maturity
securities by contractual maturity as of September 30, 2019 and
December 31, 2018 is shown below:
|
|
September
30, 2019
|
December
31, 2018
|
||
|
|
Amortized
|
Estimated
|
Amortized
|
Estimated
|
|
Remaining Time to
Maturity
|
Cost
|
Fair
Value
|
Cost
|
Fair
Value
|
|
|
|
|
|
|
|
Less
than one year
|
$12,273,128
|
$12,322,490
|
$6,742,519
|
$6,738,014
|
|
One
to five years
|
50,106,836
|
51,297,620
|
47,038,838
|
46,640,012
|
|
Five
to ten years
|
74,473,145
|
78,850,661
|
76,884,505
|
74,290,076
|
|
More
than 10 years
|
2,010,182
|
2,047,580
|
2,974,426
|
2,644,180
|
|
Residential
mortgage and other asset backed securities
|
21,737,713
|
21,702,361
|
21,790,973
|
21,465,234
|
|
Total
|
$160,601,004
|
$166,220,712
|
$155,431,261
|
$151,777,516
|
The actual maturities may differ from contractual maturities
because certain borrowers have the right to call or prepay
obligations with or without penalties.
10
Equity Securities
The
cost, estimated fair value, and gross gains and losses of
investments in equity securities as of September 30, 2019 and
December 31, 2018 are as follows:
|
|
September
30, 2019
|
|||
|
|
|
Gross
|
Gross
|
Estimated
|
|
Category
|
Cost
|
Gains
|
Losses
|
Fair
Value
|
|
|
|
|
|
|
|
Equity Securities:
|
|
|
|
|
|
Preferred
stocks
|
$8,415,227
|
$394,815
|
$(16,042)
|
$8,794,000
|
|
Common stocks and exchange
|
|
|
|
|
|
traded
mutual funds
|
13,655,339
|
1,537,211
|
(487,351)
|
14,705,199
|
|
Total
|
$22,070,566
|
$1,932,026
|
$(503,393)
|
$23,499,199
|
|
|
December
31, 2018
|
|||
|
|
|
Gross
|
Gross
|
Estimated
|
|
Category
|
Cost
|
Gains
|
Losses
|
Fair
Value
|
|
|
|
|
|
|
|
Equity Securities:
|
|
|
|
|
|
Preferred
stocks
|
$6,694,754
|
$-
|
$(541,798)
|
$6,152,956
|
|
Common stocks and exchange
|
|
|
|
|
|
traded
mutual funds
|
11,611,232
|
99,817
|
(1,291,389)
|
10,419,660
|
|
Total
|
$18,305,986
|
$99,817
|
$(1,833,187)
|
$16,572,616
|
Other Investments
The
cost, estimated fair value, and gross unrealized gains and losses
of the Company’s other investments as of September 30, 2019
and December 31, 2018 are as follows:
|
|
September
30, 2019
|
December
31, 2018
|
||||
|
|
|
Gross
|
Estimated
|
|
Gross
|
Estimated
|
|
Category
|
Cost
|
Gains
|
Fair
Value
|
Cost
|
Losses
|
Fair
Value
|
|
|
|
|
|
|
|
|
|
Other Investments:
|
|
|
|
|
|
|
|
Hedge
fund
|
$1,999,381
|
$426,523
|
$2,425,904
|
$1,999,381
|
$(144,156)
|
$1,855,225
|
|
Total
|
$1,999,381
|
$426,523
|
$2,425,904
|
$1,999,381
|
$(144,156)
|
$1,855,225
|
11
Held-to-Maturity Securities
The amortized cost, estimated fair value, and unrealized gains and
losses of investments in held-to-maturity fixed-maturity securities
as of September 30, 2019 and
December 31, 2018 are summarized as follows:
|
|
September 30, 2019
|
|||||
|
|
|
|
|
|
|
|
|
|
Cost or
|
Gross
|
Gross Unrealized Losses
|
Estimated
|
Net
|
|
|
|
Amortized
|
Unrealized
|
Less than 12
|
More than 12
|
Fair
|
Unrealized
|
|
Category
|
Cost
|
Gains
|
Months
|
Months
|
Value
|
Gains
|
|
|
|
|
|
|
|
|
|
Held-to-Maturity Securities:
|
|
|
|
|
|
|
|
U.S.
Treasury securities
|
$729,539
|
$153,088
|
$-
|
$-
|
$882,627
|
$153,088
|
|
|
|
|
|
|
|
|
|
Political subdivisions of States,
|
|
|
|
|
|
|
|
Territories
and Possessions
|
998,668
|
50,357
|
-
|
-
|
1,049,025
|
50,357
|
|
|
|
|
|
|
|
|
|
Corporate and other bonds
|
|
|
|
|
|
|
|
Industrial
and miscellaneous
|
2,097,298
|
98,434
|
-
|
-
|
2,195,732
|
98,434
|
|
|
|
|
|
|
|
|
|
Total
|
$3,825,505
|
$301,879
|
$-
|
$-
|
$4,127,384
|
$301,879
|
|
|
|
|
|
|
|
|
|
|
December
31, 2018
|
|||||
|
|
|
|
|
|
|
|
|
|
Cost
or
|
Gross
|
Gross
Unrealized Losses
|
Estimated
|
Net
|
|
|
|
Amortized
|
Unrealized
|
Less
than 12
|
More
than 12
|
Fair
|
Unrealized
|
|
Category
|
Cost
|
Gains
|
Months
|
Months
|
Value
|
Gains
|
|
|
|
|
|
|
|
|
|
Held-to-Maturity Securities:
|
|
|
|
|
|
|
|
U.S.
Treasury securities
|
$729,507
|
$147,532
|
$(3,964)
|
$-
|
$873,075
|
$143,568
|
|
|
|
|
|
|
|
|
|
Political subdivisions of States,
|
|
|
|
|
|
|
|
Territories
and Possessions
|
998,803
|
33,862
|
-
|
-
|
1,032,665
|
33,862
|
|
|
|
|
|
|
|
|
|
Corporate and other bonds
|
|
|
|
|
|
|
|
Industrial
and miscellaneous
|
2,494,545
|
38,461
|
(1,425)
|
(10,905)
|
2,520,676
|
26,131
|
|
|
|
|
|
|
|
|
|
Total
|
$4,222,855
|
$219,855
|
$(5,389)
|
$(10,905)
|
$4,426,416
|
$203,561
|
Held-to-maturity U.S. Treasury securities are held in trust
pursuant to various states’ minimum funds
requirements.
A summary of the amortized cost and estimated fair value of the
Company’s investments in held-to-maturity securities by
contractual maturity as of September 30, 2019 and December 31, 2018
is shown below:
|
|
September 30,
2019
|
December 31,
2018
|
||
|
|
Amortized
|
Estimated
|
Amortized
|
Estimated
|
|
Remaining Time to
Maturity
|
Cost
|
Fair Value
|
Cost
|
Fair Value
|
|
|
|
|
|
|
|
Less
than one year
|
$623,000
|
$629,143
|
$-
|
$-
|
|
One
to five years
|
$2,098,950
|
$2,214,947
|
2,996,685
|
3,036,531
|
|
Five
to ten years
|
$497,016
|
$529,255
|
619,663
|
635,846
|
|
More
than 10 years
|
$606,539
|
$754,039
|
606,507
|
754,039
|
|
Total
|
$3,825,505
|
$4,127,384
|
$4,222,855
|
$4,426,416
|
The actual maturities may differ from contractual maturities
because certain borrowers have the right to call or prepay
obligations with or without penalties.
12
Investment Income
Major categories of the Company’s net investment income are
summarized as follows:
|
|
Three
months ended
|
Nine
months ended
|
||
|
|
September
30,
|
September
30,
|
||
|
|
2019
|
2018
|
2019
|
2018
|
|
|
|
|
|
|
|
Income:
|
|
|
|
|
|
Fixed-maturity
securities
|
$1,499,135
|
$1,386,931
|
$4,500,346
|
$3,898,730
|
|
Equity
securities
|
253,594
|
214,498
|
666,247
|
609,086
|
|
Cash
and cash equivalents
|
75,253
|
44,024
|
288,334
|
159,865
|
|
Total
|
1,827,982
|
1,645,453
|
5,454,927
|
4,667,681
|
|
Expenses:
|
|
|
|
|
|
Investment
expenses
|
(28,571)
|
43,082
|
254,893
|
124,455
|
|
Net
investment income
|
$1,856,553
|
$1,602,371
|
$5,200,034
|
$4,543,226
|
Proceeds from the sale and redemption of fixed-maturity securities
held-to-maturity were $400,000 and $624,963 for the nine months
ended September 30, 2019 and 2018, respectively.
Proceeds from the sale or maturity of fixed-maturity securities
available-for-sale were $9,835,464 and $17,740,260 for the nine
months ended September 30, 2019 and 2018,
respectively.
Proceeds from the sale of equity securities were $2,941,492 and
$5,694,121 for the nine months ended September 30, 2019 and 2018,
respectively.
13
The Company’s net gains (losses) on investments are
summarized as follows:
|
|
Three
months ended
|
Nine
months ended
|
||
|
|
September
30,
|
September
30,
|
||
|
|
2019
|
2018
|
2019
|
2018
|
|
Realized Gains (Losses)
|
|
|
|
|
|
|
|
|
|
|
|
Fixed-maturity securities:
|
|
|
|
|
|
Gross
realized gains
|
$10
|
$4,749
|
$10,954
|
$116,961
|
|
Gross
realized losses
|
(46,851)
|
(77,191)
|
(92,591)
|
(560,418)
|
|
|
(46,841)
|
(72,442)
|
(81,637)
|
(443,457)
|
|
|
|
|
|
|
|
Equity securities:
|
|
|
|
|
|
Gross
realized gains
|
38,477
|
121,609
|
83,737
|
436,859
|
|
Gross
realized losses
|
-
|
(106,321)
|
(56,859)
|
(370,705)
|
|
|
38,477
|
15,288
|
26,878
|
66,154
|
|
|
|
|
|
|
|
Net
realized losses
|
(8,364)
|
(57,154)
|
(54,759)
|
(377,303)
|
|
|
|
|
|
|
|
Unrealized Gains (Losses)
|
|
|
|
|
|
|
|
|
|
|
|
Equity securities:
|
|
|
|
|
|
Gross
gains
|
916,496
|
-
|
3,196,260
|
-
|
|
Gross
losses
|
-
|
288,435
|
-
|
(141,976)
|
|
|
916,496
|
288,435
|
3,196,260
|
(141,976)
|
|
|
|
|
|
|
|
Other investments:
|
|
|
|
|
|
Gross
gains
|
90,030
|
120,744
|
570,679
|
241,444
|
|
Gross
losses
|
-
|
-
|
-
|
-
|
|
|
90,030
|
120,744
|
570,679
|
241,444
|
|
|
|
|
|
|
|
Net
unrealized gains
|
1,006,526
|
409,179
|
3,766,939
|
99,468
|
|
|
|
|
|
|
|
Net
gains (losses) on investments
|
$998,162
|
$352,025
|
$3,712,180
|
$(277,835)
|
Impairment Review
Impairment of investment securities results in a charge to
operations when a market decline below cost is deemed to be
other-than-temporary. The Company regularly reviews its
fixed-maturity securities to evaluate the necessity of recording
impairment losses for other-than-temporary declines in the
estimated fair value of investments. In evaluating potential
impairment, GAAP specifies (i) if the Company does not have the
intent to sell a debt security prior to recovery and (ii) it is
more likely than not that it will not have to sell the debt
security prior to recovery, the security would not be considered
other-than-temporarily impaired unless there is a credit
loss. When the Company does not intend to sell the security
and it is more likely than not that the Company will not have to
sell the security before recovery of its cost basis, it will
recognize the credit component of an other-than-temporary
impairment (“OTTI”) of a debt security in earnings and
the remaining portion in comprehensive income (loss). The
credit loss component recognized in earnings is identified as the
amount of principal cash flows not expected to be received over the
remaining term of the security as projected based on cash flow
projections. For held-to-maturity debt securities, the amount
of OTTI recorded in comprehensive loss for the noncredit portion of
a previous OTTI is amortized prospectively over the remaining life
of the security on the basis of timing of future estimated cash
flows of the security.
OTTI losses are recorded in the condensed consolidated statements
of operations and comprehensive income (loss) as net realized
losses on investments and result in a permanent reduction of the
cost basis of the underlying investment. The determination of OTTI
is a subjective process and different judgments and assumptions
could affect the timing of loss realization. At September 30, 2019
and December 31, 2018, there were 38 and 156 fixed-maturity
securities, respectively, that accounted for the gross unrealized
loss. The Company determined that none of the unrealized losses
were deemed to be OTTI for its portfolio of investments for the
nine months ended September 30, 2019 and 2018. Significant factors
influencing the Company’s determination that unrealized
losses were temporary included the magnitude of the unrealized
losses in relation to each security’s cost, the nature of the
investment and management’s intent and ability to retain the
investment for a period of time sufficient to allow for an
anticipated recovery of estimated fair value to the Company’s
cost basis.
14
The Company held available-for-sale securities with unrealized
losses representing declines that were considered temporary at
September 30, 2019 as follows:
|
|
September
30, 2019
|
|||||||
|
|
Less
than 12 months
|
12
months or more
|
Total
|
|||||
|
|
Estimated
|
|
No.
of
|
Estimated
|
|
No.
of
|
Estimated
|
|
|
|
Fair
|
Unrealized
|
Positions
|
Fair
|
Unrealized
|
Positions
|
Fair
|
Unrealized
|
|
Category
|
Value
|
Losses
|
Held
|
Value
|
Losses
|
Held
|
Value
|
Losses
|
|
|
|
|
|
|
|
|
|
|
| Fixed-Maturity Securities: |
|
|
|
|
|
|
|
|
|
U.S. Treasury securities
|
|
|
|
|
|
|
|
|
|
and
obligations of U.S.
|
|
|
|
|
|
|
|
|
| government corporations |
|
|
|
|
|
|
|
|
|
and
agencies
|
$-
|
$-
|
-
|
$-
|
$-
|
-
|
$-
|
$-
|
|
|
|
|
|
|
|
|
|
|
|
Political
subdivisions of
|
|
|
|
|
|
|
|
|
|
States,
Territories and
|
|
|
|
|
|
|
|
|
|
Possessions
|
-
|
-
|
-
|
-
|
-
|
-
|
-
|
-
|
|
|
|
|
|
|
|
|
|
|
|
Corporate
and other
|
|
|
|
|
|
|
|
|
|
bonds
industrial and
|
|
|
|
|
|
|
|
|
|
miscellaneous
|
3,258,185
|
(33,073)
|
6
|
3,170,889
|
(20,893)
|
6
|
6,429,074
|
(53,966)
|
|
|
|
|
|
|
|
|
|
|
|
Residential mortgage and other
|
|
|
|
|
|
|
|
|
|
asset
backed securities
|
3,008,874
|
(19,924)
|
3
|
15,596,316
|
(312,685)
|
23
|
18,605,190
|
(332,609)
|
|
|
|
|
|
|
|
|
|
|
|
Total
fixed-maturity
|
|
|
|
|
|
|
|
|
|
securities
|
$6,267,059
|
$(52,997)
|
9
|
$18,767,205
|
$(333,578)
|
29
|
$25,034,264
|
$(386,575)
|
15
The Company held available-for-sale securities with unrealized
losses representing declines that were considered temporary at
December 31, 2018 as follows:
|
|
December
31, 2018
|
|||||||
|
|
Less
than 12 months
|
12
months or more
|
Total
|
|||||
|
|
Estimated
|
|
No.
of
|
Estimated
|
|
No.
of
|
Estimated
|
|
|
|
Fair
|
Unrealized
|
Positions
|
Fair
|
Unrealized
|
Positions
|
Fair
|
Unrealized
|
|
Category
|
Value
|
Losses
|
Held
|
Value
|
Losses
|
Held
|
Value
|
Losses
|
|
|
|
|
|
|
|
|
|
|
|
Fixed-Maturity Securities:
|
|
|
|
|
|
|
|
|
|
U.S.
Treasury securities
|
|
|
|
|
|
|
|
|
|
and
obligations of U.S.
|
|
|
|
|
|
|
|
|
|
government
corporations
|
|
|
|
|
|
|
|
|
|
and
agencies
|
$4,948,530
|
$(28,000)
|
3
|
$-
|
$-
|
-
|
$4,948,530
|
$(28,000)
|
|
|
|
|
|
|
|
|
|
|
|
Political
subdivisions of
|
|
|
|
|
|
|
|
|
|
States,
Territories and
|
|
|
|
|
|
|
|
|
|
Possessions
|
555,375
|
(12,327)
|
1
|
1,436,242
|
(36,508)
|
3
|
1,991,617
|
(48,835)
|
|
|
|
|
|
|
|
|
|
|
|
Corporate
and other
|
|
|
|
|
|
|
|
|
|
bonds
industrial and
|
|
|
|
|
|
|
|
|
|
miscellaneous
|
81,004,459
|
(2,775,540)
|
97
|
13,424,888
|
(676,605)
|
24
|
94,429,347
|
(3,452,145)
|
|
|
|
|
|
|
|
|
|
|
|
Residential
mortgage and other
|
|
|
|
|
|
|
|
|
|
asset
backed securities
|
7,002,713
|
(231,229)
|
9
|
11,928,425
|
(331,012)
|
19
|
18,931,138
|
(562,241)
|
|
|
|
|
|
|
|
|
|
|
|
Total
fixed-maturity
|
|
|
|
|
|
|
|
|
|
securities
|
$93,511,077
|
$(3,047,096)
|
110
|
$26,789,555
|
$(1,044,125)
|
46
|
$120,300,632
|
$(4,091,221)
|
16
Note 4 - Fair Value Measurements
Fair value is the price that would be received upon sale of an
asset or paid to transfer a liability in an orderly transaction
between market participants at the measurement date. The valuation
technique used by the Company to fair value its financial
instruments is the market approach, which uses prices and other
relevant information generated by market transactions involving
identical or comparable assets.
The fair value hierarchy gives the highest priority to quoted
prices in active markets for identical assets or liabilities
(Level 1) and the lowest priority to unobservable inputs
(Level 3). If the inputs used to measure the assets or
liabilities fall within different levels of the hierarchy, the
classification is based on the lowest level input that is
significant to the fair value measurement of the asset or
liability. Classification of assets and liabilities within the
hierarchy considers the markets in which the assets and liabilities
are traded, including during period of market disruption, and the
reliability and transparency of the assumptions used to determine
fair value. The hierarchy requires the use of observable market
data when available. The levels of the hierarchy and those
investments included in each are as follows:
Level 1—Inputs to
the valuation methodology are quoted prices (unadjusted) for
identical assets or liabilities traded in active markets. Included
are those investments traded on an active exchange, such as the
Nasdaq Global Select Market, U.S. Treasury securities and
obligations of U.S. government agencies, together with
corporate debt securities that are generally investment
grade.
Level 2—Inputs to
the valuation methodology include quoted prices for similar assets
or liabilities in active markets, quoted prices for identical or
similar assets or liabilities in markets that are not active,
inputs other than quoted prices that are observable for the asset
or liability and market-corroborated inputs. Municipal and
corporate bonds, and residential mortgage-backed securities, that
are traded in less active markets are classified as Level 2.
These securities are valued using market price quotations for
recently executed transactions.
Level 3—Inputs to
the valuation methodology are unobservable for the asset or
liability and are significant to the fair value measurement.
Material assumptions and factors considered in pricing investment
securities and other assets may include appraisals, projected cash
flows, market clearing activity or liquidity circumstances in the
security or similar securities that may have occurred since the
prior pricing period.
The availability of observable inputs varies and is affected by a
wide variety of factors. When the valuation is based on models or
inputs that are less observable or unobservable in the market, the
determination of fair value requires significantly more judgment.
The degree of judgment exercised by management in determining fair
value is greatest for investments categorized as Level 3. For
investments in this category, the Company considers prices and
inputs that are current as of the measurement date. In periods of
market dislocation, as characterized by current market conditions,
the ability to observe prices and inputs may be reduced for many
instruments. This condition could cause a security to be
reclassified between levels.
17
The following table presents information about the Company’s
investments that are measured at fair value on a recurring basis at
September 30, 2019 and December 31, 2018 indicating the fair value
hierarchy of the valuation inputs the Company utilized to determine
such fair value:
|
|
September
30, 2019
|
|||
|
|
Level
1
|
Level
2
|
Level
3
|
Total
|
|
|
|
|
|
|
|
Fixed-maturity securities available-for-sale
|
|
|
|
|
|
U.S.
Treasury securities
|
|
|
|
|
|
and
obligations of U.S.
|
|
|
|
|
|
government
corporations
|
|
|
|
|
|
and
agencies
|
$8,399,552
|
$-
|
$-
|
$8,399,552
|
|
|
|
|
|
|
|
Political
subdivisions of
|
|
|
|
|
|
States,
Territories and
|
|
|
|
|
|
Possessions
|
-
|
5,850,005
|
-
|
5,850,005
|
|
|
|
|
|
|
|
Corporate
and other
|
|
|
|
|
|
bonds
industrial and
|
|
|
|
|
|
miscellaneous
|
127,148,873
|
3,119,921
|
-
|
130,268,794
|
|
|
|
|
|
|
|
Residential
mortgage backed securities
|
-
|
21,702,361
|
-
|
21,702,361
|
|
Total
fixed maturities
|
135,548,425
|
30,672,287
|
-
|
166,220,712
|
|
Equity securities
|
23,499,199
|
-
|
-
|
23,499,199
|
|
Total
investments
|
$159,047,624
|
$30,672,287
|
$-
|
$189,719,911
|
|
|
December
31, 2018
|
|||
|
|
Level
1
|
Level
2
|
Level
3
|
Total
|
|
|
|
|
|
|
|
Fixed-maturity securities available-for-sale
|
|
|
|
|
|
U.S.
Treasury securities
|
|
|
|
|
|
and
obligations of U.S.
|
|
|
|
|
|
government
corporations
|
|
|
|
|
|
and
agencies
|
$8,220,381
|
$-
|
$-
|
$8,220,381
|
|
|
|
|
|
|
|
Political
subdivisions of
|
|
|
|
|
|
States,
Territories and
|
|
|
|
|
|
Possessions
|
-
|
6,341,608
|
-
|
6,341,608
|
|
|
|
|
|
|
|
Corporate
and other
|
|
|
|
|
|
bonds
industrial and
|
|
|
|
|
|
miscellaneous
|
112,076,270
|
3,674,023
|
-
|
115,750,293
|
|
|
|
|
|
|
|
Residential
mortgage backed securities
|
-
|
21,465,234
|
-
|
21,465,234
|
|
Total
fixed maturities
|
120,296,651
|
31,480,865
|
-
|
151,777,516
|
|
Equity securities
|
16,572,616
|
-
|
-
|
16,572,616
|
|
Total
investments
|
$136,869,267
|
$31,480,865
|
$-
|
$168,350,132
|
18
Pursuant to ASC 820 “Fair Value Measurement,” an entity
is permitted, as a practical expedient, to estimate the fair value
of an investment within the scope of ASC 820 using the net asset
value (“NAV”) per share of the investment. The
following table sets forth the Company’s investment in a
hedge fund measured at NAV per share as of September 30, 2019 and
December 31, 2018. The Company measures this investment at fair
value on a recurring basis. Fair value using NAV per share is as
follows as of the dates indicated:
|
Category
|
September
30, 2019
|
December
31, 2018
|
|
|
|
|
|
Other Investments:
|
|
|
|
Hedge
fund
|
$2,425,904
|
$1,855,225
|
|
Total
|
$2,425,904
|
$1,855,225
|
The investment is generally redeemable with at least 45 days prior
written notice. The hedge fund investment is accounted for as a
limited partnership by the Company. Income is earned based upon the
Company’s allocated share of the partnership's changes in
unrealized gains and losses to its partners. Such amounts have been
recorded in the condensed consolidated statements of operations and
comprehensive income (loss) within net gains (losses) on
investments.
The
estimated fair value and the level of the fair value hierarchy of
the Company’s long-term debt as of September 30, 2019 and
December 31, 2018 not measured at fair value is as
follows:
|
|
September 30, 2019
|
|||
|
|
Level 1
|
Level 2
|
Level 3
|
Total
|
|
Long-term debt
|
|
|
|
|
|
|
|
|
|
|
|
Senior
Notes due 2022
|
$-
|
$27,310,623
|
$-
|
$27,310,623
|
|
|
December
31, 2018
|
|||
|
|
Level
1
|
Level
2
|
Level
3
|
Total
|
|
Long-term debt
|
|
|
|
|
|
|
|
|
|
|
|
Senior
Notes due 2022
|
$-
|
$28,521,734
|
$-
|
$28,521,734
|
19
Note 5 - Fair Value of Financial Instruments and Real
Estate
The Company uses the following methods and assumptions in
estimating the fair value of financial instruments and real
estate:
Equity securities, available-for-sale fixed income securities,
held-to-maturity fixed income securities, and other
investments: Fair value disclosures for these investments are
included in “Note 3 - Investments” and “Note
4 – Fair Value Measurements”.
Cash and cash equivalents: The carrying values of cash and
cash equivalents approximate their fair values because of the
short-term nature of these instruments.
Premiums receivable and reinsurance receivables: The carrying values reported in the
condensed consolidated balance sheets for these financial
instruments approximate their fair values due to the short-term
nature of the assets.
Real estate: The fair value of the land and building
included in property and equipment, which is used in the
Company’s operations, approximates the carrying value. The
fair value was based on an appraisal prepared using the sales
comparison approach, and accordingly the real estate is a Level 3
asset under the fair value hierarchy.
Reinsurance balances payable: The carrying value reported in the
condensed consolidated balance sheets for these financial
instruments approximates fair value.
Long-term debt: The estimated fair value of
long-term debt is based on observable market interest rates when
available. When observable market interest rates were not
available, the estimated fair values of debt were based on
observable market interest rates of comparable instruments adjusted
for differences between the observed instruments and the
instruments being valued or estimated using discounted cash flow
analyses, based on current incremental borrowing rates for similar
types of borrowing arrangements.
The
estimated fair values of the Company’s financial instruments
and real estate as of September 30,
2019 and December 31, 2018 are as follows:
|
|
September
30, 2019
|
December
31, 2018
|
||
|
|
Carrying
|
Estimated
|
Carrying
|
Estimated
|
|
|
Value
|
Fair
Value
|
Value
|
Fair
Value
|
|
|
|
|
|
|
|
Fixed-maturity
securities-held-to maturity
|
$3,825,505
|
$4,127,384
|
$4,222,855
|
$4,426,416
|
|
Cash
and cash equivalents
|
$25,639,050
|
$25,639,050
|
$21,138,403
|
$21,138,403
|
|
Premiums
receivable, net
|
$14,352,521
|
$14,352,521
|
$13,961,599
|
$13,961,599
|
|
Reinsurance
receivables, net
|
$26,580,449
|
$26,580,449
|
$26,367,115
|
$26,367,115
|
|
Real
estate, net of accumulated depreciation
|
$2,288,851
|
$2,705,000
|
$2,300,827
|
$2,705,000
|
|
Reinsurance
balances payable
|
$809,836
|
$809,836
|
$1,933,376
|
$1,933,376
|
|
Long-term
debt, net
|
$29,427,386
|
$27,310,623
|
$29,295,251
|
$28,521,734
|
20
Note 6 – Property and Casualty Insurance
Activity
Premiums Earned
Premiums written, ceded and earned are as follows:
|
|
Direct
|
Assumed
|
Ceded
|
Net
|
|
|
|
|
|
|
|
Nine months ended September 30, 2019
|
|
|
|
|
|
Premiums
written
|
$128,333,117
|
$938
|
$(20,914,074)
|
$107,419,981
|
|
Change
in unearned premiums
|
(11,035,993)
|
(559)
|
(1,366,251)
|
(12,402,803)
|
|
Premiums
earned
|
$117,297,124
|
$379
|
$(22,280,325)
|
$95,017,178
|
|
|
|
|
|
|
|
Nine months ended September 30, 2018
|
|
|
|
|
|
Premiums
written
|
$107,175,413
|
$842
|
$(19,409,423)
|
$87,766,832
|
|
Change
in unearned premiums
|
(9,930,503)
|
3,762
|
(3,363,953)
|
$(13,290,694)
|
|
Premiums
earned
|
$97,244,910
|
$4,604
|
$(22,773,376)
|
$74,476,138
|
|
|
|
|
|
|
|
Three months ended September 30, 2019
|
|
|
|
|
|
Premiums
written
|
$46,023,290
|
$861
|
$(5,586,278)
|
$40,437,873
|
|
Change
in unearned premiums
|
(4,579,777)
|
(761)
|
(1,637,325)
|
(6,217,863)
|
|
Premiums
earned
|
$41,443,513
|
$100
|
$(7,223,603)
|
$34,220,010
|
|
|
|
|
|
|
|
Three months ended September 30, 2018
|
|
|
|
|
|
Premiums
written
|
$38,785,453
|
$18
|
$(2,683,699)
|
$36,101,772
|
|
Change
in unearned premiums
|
(4,435,174)
|
698
|
(4,133,389)
|
(8,567,865)
|
|
Premiums
earned
|
$34,350,279
|
$716
|
$(6,817,088)
|
$27,533,907
|
Premium
receipts in advance of the policy effective date are recorded as
advance premiums. The balance of advance premiums as of September
30, 2019 and December 31, 2018
was $3,737,491 and
$2,107,629, respectively.
21
Loss and Loss Adjustment Expense Reserves
The following table provides a reconciliation of the beginning and
ending balances for unpaid losses and loss adjustment expense
(“LAE”) reserves:
|
|
Nine
months ended
|
|
|
|
September
30,
|
|
|
|
2019
|
2018
|
|
|
|
|
|
Balance
at beginning of period
|
$56,197,106
|
$48,799,622
|
|
Less
reinsurance recoverables
|
(15,671,247)
|
(16,748,908)
|
|
Net
balance, beginning of period
|
40,525,859
|
32,050,714
|
|
|
|
|
|
Incurred
related to:
|
|
|
|
Current
year
|
60,401,821
|
41,611,658
|
|
Prior
years
|
11,186,029
|
127,465
|
|
Total
incurred
|
71,587,850
|
41,739,123
|
|
|
|
|
|
Paid
related to:
|
|
|
|
Current
year
|
31,515,656
|
23,404,909
|
|
Prior
years
|
18,600,946
|
12,160,419
|
|
Total
paid
|
50,116,602
|
35,565,328
|
|
|
|
|
|
Net
balance at end of period
|
61,997,107
|
38,224,509
|
|
Add
reinsurance recoverables
|
15,412,316
|
15,718,448
|
|
Balance
at end of period
|
$77,409,423
|
$53,942,957
|
Incurred losses and LAE are net of reinsurance recoveries under
reinsurance contracts of $8,849,440 and $11,668,527 for the nine
months ended September 30, 2019 and 2018,
respectively.
Prior
year incurred loss and LAE development is based upon estimates by
line of business and accident year. Prior year loss and LAE
development incurred during the nine months ended September
30, 2019 and 2018 was
$11,186,029 unfavorable and $127,465 unfavorable, respectively.
During the nine months ended September 30, 2019, the Company
increased case reserves for a significant number of older liability
claims, which primarily affected the ultimate loss projections for
commercial lines business. These adjustments were in line with
management’s continued process of monitoring claims activity
to assess the appropriateness of carried case and incurred but not
reported (“IBNR”) reserves, giving consideration to both Company and industry
trends.
The reserving process for loss and LAE reserves provides for the
Company’s best estimate at a particular point in time of the
ultimate unpaid cost of all losses and LAE incurred, including
settlement and administration of losses, and is based on facts and
circumstances then known including losses that have occurred but
that have not yet been reported. The process relies on standard
actuarial reserving methodologies, judgments relative to estimates
of ultimate claim severity and frequency, the length of time before
losses will develop to their ultimate level (‘tail’
factors), and the likelihood of changes in the law or other
external factors that are beyond the Company’s control.
Several actuarial reserving methodologies are used to estimate
required loss reserves. The process produces carried reserves set
by management based upon the actuaries’ best estimate and is
the cumulative combination of the best estimates made by line of
business, accident year, and loss and LAE. The amount of loss and
LAE reserves for individual reported claims (the “case
reserve”) is determined by the claims department and changes
over time as new information is gathered. Such information is
critical to the review of appropriate IBNR reserves and includes a
review of coverage applicability, comparative liability on the part
of the insured, injury severity, property damage, replacement cost
estimates, and any other information considered pertinent to
estimating the exposure presented by the claim. The amounts of loss
and LAE reserves for unreported claims and development on known
claims (IBNR reserves) are determined using historical information
aggregated by line of insurance as adjusted to current conditions.
Since this process produces loss reserves set by management based
upon the actuaries’ best estimate, there is no explicit or
implicit provision for uncertainty in the carried loss
reserves.
Due to the inherent uncertainty associated with the reserving
process, the ultimate liability may differ, perhaps substantially,
from the original estimate. Such estimates are regularly reviewed
and updated and any resulting adjustments are included in the
current period’s results. Reserves are closely monitored and
are recomputed periodically using the most recent information on
reported claims and a variety of statistical techniques. On at
least a quarterly basis, the Company reviews by line of business
existing reserves, new claims, changes to existing case reserves,
and paid losses with respect to the current and prior periods.
Several methods are used, varying by line of business and accident
year, in order to select the estimated period-end loss reserves.
These methods include the
following:
22
Paid Loss Development
– historical patterns of paid
loss development are used to project future paid loss emergence in
order to estimate required reserves.
Incurred Loss
Development – historical
patterns of incurred loss development, reflecting both paid losses
and changes in case reserves, are used to project future incurred
loss emergence in order to estimate required
reserves.
Paid Bornhuetter-Ferguson
(“BF”) – an
estimated loss ratio for a particular accident year is determined,
and is weighted against the portion of the accident year claims
that have been paid, based on historical paid loss development
patterns. The estimate of required reserves assumes that the
remaining unpaid portion of a particular accident year will pay out
at a rate consistent with the estimated loss ratio for that year.
This method can be useful for situations where an unusually high or
low amount of paid losses exists at the early stages of the claims
development process.
Incurred Bornhuetter-Ferguson
(“BF”) - an
estimated loss ratio for a particular accident year is determined,
and is weighted against the portion of the accident year claims
that have been reported, based on historical incurred loss
development patterns. The estimate of required reserves assumes
that the remaining unreported portion of a particular accident year
will pay out at a rate consistent with the estimated loss ratio for
that year. This method can be useful for situations where an
unusually high or low amount of reported losses exists at the early
stages of the claims development process.
Incremental Claim-Based
Methods – historical
patterns of incremental incurred losses and paid LAE during various
stages of development are reviewed and assumptions are made
regarding average loss and LAE development applied to remaining
claims inventory. Such methods more properly reflect changes in the
speed of claims closure and the relative adequacy of case reserve
levels at various stages of development. These methods may provide
a more accurate estimate of IBNR for lines of business with
relatively few remaining open claims but for which significant
recent settlement activity has occurred.
Frequency / Severity Based
Methods – historical
measurements of claim frequency and average paid claim size
(severity) are reviewed for more mature accident years where a
majority of claims have been reported and/or closed. These
historical averages are trended forward to more recent periods in
order to estimate ultimate losses for newer accident years that are
not yet fully developed. These methods are useful for lines of
business with slow and/or volatile loss development patterns, such
as liability lines where information pertaining to individual cases
may not be completely known for many years. The claim frequency and
severity information for older periods can then be used as
reasonable measures for developing a range of estimates for more
recent immature periods.
Management’s best estimate of required reserves is generally
based on an average of the methods above, with appropriate
weighting of methods based on the line of business and accident
year being projected. In some cases, additional methods or
historical data from industry sources are employed to supplement
the projections derived from the methods listed above.
Two key assumptions that materially affect the estimate of loss
reserves are the loss ratio estimate for the current accident year
used in the BF methods described above, and the loss development
factor selections used in the loss development methods described
above. The loss ratio estimates used in the BF methods are selected
after reviewing historical accident year loss ratios adjusted for
rate changes, trend, and mix of business.
The Company is not aware of any claim trends that have emerged or
that would cause future adverse development that have not already
been contemplated in setting current carried reserves
levels.
In New York State, lawsuits for negligence are subject to certain
limitations and must be commenced within three years from the date
of the accident or are otherwise barred. Accordingly, the
Company’s exposure to unreported claims (“pure”
IBNR) for accident dates of September 30, 2016 and prior is
limited, although there remains the possibility of adverse
development on reported claims (“case development”
IBNR). In certain rare circumstances states have retroactively
revised a statute of limitations. The Company is not aware of any
such effort that would have a material impact on the
Company’s results.
The
following is information about incurred and paid claims development
as of September 30, 2019, net of reinsurance, as well as the
cumulative reported claims by accident year and total IBNR reserves
as of September 30, 2019 included in the net incurred loss and
allocated expense amounts. The historical information regarding
incurred and paid claims development for the years ended December
31, 2010 to December 31, 2018 is presented as supplementary
unaudited information.
All Lines of Business
(in thousands, except reported claims data)
|
|
|
|
|
|
|
|
|
|
|
|
As of
|
|
|
|
Incurred Loss and Allocated Loss
Adjustment Expenses, Net of Reinsurance
|
|
|
September 30,
2019
|
||||||||
|
Accident
|
For the Years Ended December
31,
|
Nine Months Ended September
30,
|
|
Cumulative Number of Reported
Claims by Accident
|
||||||||
|
Year
|
2010
|
2011
|
2012
|
2013
|
2014
|
2015
|
2016
|
2017
|
2018
|
2019
|
IBNR
|
Year
|
|
|
Unaudited 2010 -
2018
|
(Unaudited)
|
||||||||||
|
|
|
|
|
|
|
|
|
|
|
|
|
|
|
2010
|
$5,598
|
$5,707
|
$6,429
|
$6,623
|
$6,912
|
$6,853
|
$6,838
|
$6,840
|
$6,787
|
$6,793
|
$-
|
1,617
|
|
2011
|
|
7,603
|
7,678
|
8,618
|
9,440
|
9,198
|
9,066
|
9,144
|
9,171
|
9,161
|
14
|
1,914
|
|
2012
|
|
|
9,539
|
9,344
|
10,278
|
10,382
|
10,582
|
10,790
|
10,791
|
11,016
|
79
|
4,704(1)
|
|
2013
|
|
|
|
10,728
|
9,745
|
9,424
|
9,621
|
10,061
|
10,089
|
10,571
|
95
|
1,561
|
|
2014
|
|
|
|
|
14,193
|
14,260
|
14,218
|
14,564
|
15,023
|
16,576
|
454
|
2,134
|
|
2015
|
|
|
|
|
|
22,340
|
21,994
|
22,148
|
22,491
|
23,408
|
311
|
2,555
|
|
2016
|
|
|
|
|
|
|
26,062
|
24,941
|
24,789
|
28,209
|
883
|
2,873
|
|
2017
|
|
|
|
|
|
|
|
31,605
|
32,169
|
34,848
|
879
|
3,368
|
|
2018
|
|
|
|
|
|
|
|
|
54,455
|
56,320
|
3,091
|
4,162
|
|
2019
|
|
|
|
|
|
|
|
|
|
57,364
|
16,404
|
3,118
|
|
|
|
|
|
|
|
|
|
|
Total
|
$254,266
|
|
|
(1)
Reported claims for accident year 2012 includes 3,406 claims from
Superstorm Sandy.
23
|
All Lines of Business
|
|
|
|
|
|
|
|
|||
|
(in thousands)
|
|
|
|
|
|
|
|
|
||
|
|
Cumulative
Paid Loss and Allocated Loss Adjustment Expenses, Net of
Reinsurance
|
|||||||||
|
|
For the
Years Ended December 31,
|
Nine
Months
Ended
September
30,
|
||||||||
|
Accident Year
|
2010
|
2011
|
2012
|
2013
|
2014
|
2015
|
2016
|
2017
|
2018
|
2019
|
|
|
(Unaudited 2010 -
2018)
|
|
|
|
|
(Unaudited)
|
||||
|
|
|
|
|
|
|
|
|
|
|
|
|
2010
|
$2,566
|
$3,947
|
$4,972
|
$5,602
|
$6,323
|
$6,576
|
$6,720
|
$6,772
|
$6,780
|
$6,780
|
|
2011
|
|
3,740
|
5,117
|
6,228
|
7,170
|
8,139
|
8,540
|
8,702
|
8,727
|
8,778
|
|
2012
|
|
|
3,950
|
5,770
|
7,127
|
8,196
|
9,187
|
10,236
|
10,323
|
10,422
|
|
2013
|
|
|
|
3,405
|
5,303
|
6,633
|
7,591
|
8,407
|
9,056
|
9,235
|
|
2014
|
|
|
|
|
5,710
|
9,429
|
10,738
|
11,770
|
13,819
|
14,692
|
|
2015
|
|
|
|
|
|
12,295
|
16,181
|
18,266
|
19,984
|
20,982
|
|
2016
|
|
|
|
|
|
|
15,364
|
19,001
|
21,106
|
22,988
|
|
2017
|
|
|
|
|
|
|
|
16,704
|
24,820
|
27,470
|
|
2018
|
|
|
|
|
|
|
|
|
32,383
|
43,383
|
|
2019
|
|
|
|
|
|
|
|
|
|
30,115
|
|
|
|
|
|
|
|
|
|
|
Total
|
$194,845
|
|
|
|
|
|
|
|
|
|
|
|
|
|
Net liability for unpaid loss and allocated loss adjustment
expenses for the accident years presented
|
$59,421
|
|||||||||
|
All outstanding liabilities before 2010, net of
reinsurance
|
|
143
|
||||||||
|
Liabilities for loss and allocated loss adjustment expenses, net of
reinsurance
|
$59,564
|
|||||||||
Reported claim counts are measured on an occurrence or per event
basis. A single claim occurrence could result in more than
one loss type or claimant; however, the Company counts claims at
the occurrence level as a single claim regardless of the number of
claimants or claim features involved.
The
reconciliation of the net incurred and paid loss development tables
to the loss and LAE reserves in the consolidated balance sheet is
as follows:
|
|
As
of
|
|
(in thousands)
|
September
30, 2019
|
|
Liabilities
for loss and loss adjustment expenses, net of
reinsurance
|
$59,564
|
|
Total
reinsurance recoverable on unpaid losses
|
15,412
|
|
Unallocated
loss adjustment expenses
|
2,433
|
|
Total
gross liability for loss and LAE reserves
|
$77,409
|
Reinsurance
The
Company’s quota share reinsurance treaties are on a July 1
through June 30 fiscal year basis. The Company’s quota share
reinsurance treaties in effect during the nine months ended
September 30, 2019 and 2018 for its personal lines business, which
primarily consists of homeowners’ policies, were covered
under a treaty covering a two-year period from July 1, 2017 through
June 30, 2019 (“2017/2019 Treaty”). The treaty in
effect during the nine months ended September 30, 2019 was covered
under the July 1, 2018 through June 30, 2019 treaty year
(“2018/2019 Treaty Year”). The treaties in effect
during the nine months ended September 30, 2018 were covered under
the July 1, 2017 through June 30, 2018 treaty year
(“2017/2018 Treaty Year”) and the 2018/2019 Treaty Year
that began on July 1, 2018.
In
August 2018, the Company terminated its contract with one of the
reinsurers that was a party to the 2017/2019 Treaty. This
termination was retroactive to July 1, 2018 and had the effect of
reducing the quota share ceding rate to 10% under the 2018/2019
Treaty Year from 20% under the 2017/2018 Treaty Year.
24
Effective
July 1, 2019, the 2017/2019 Treaty and commercial umbrella treaty
expired on a run-off basis; these treaties were not renewed. The
Company entered into new excess of loss and catastrophe reinsurance
treaties effective July 1, 2019. Material terms for reinsurance
treaties in effect for the treaty years shown below are as
follows:
|
|
Treaty
Year
|
||
|
|
July 1,
2019
|
July 1,
2018
|
July 1,
2017
|
|
|
to
|
to
|
to
|
|
Line of Busines
|
June 30,
2020
|
June 30,
2019
|
June 30,
2018
|
|
|
|
|
|
|
Personal Lines:
|
|
|
|
|
Homeowners,
dwelling fire and canine legal liability
|
|
|
|
|
Quota
share treaty:
|
|
|
|
|
Percent
ceded
|
None
|
10%
|
20%
|
|
Risk
retained
|
$1,000,000
|
$900,000
|
$800,000
|
|
Losses
per occurrence subject to quota share reinsurance
coverage
|
None
|
$1,000,000
|
$1,000,000
|
|
Excess
of loss coverage and facultative facility above quota share
coverage (1)
|
$10,000,000
|
$9,000,000
|
$9,000,000
|
|
|
|
in
excess of
|
in
excess of
|
|
|
|
$1,000,000
|
$1,000,000
|
|
Total
reinsurance coverage per occurrence
|
$9,000,000
|
$9,100,000
|
$9,200,000
|
|
Losses
per occurrence subject to reinsurance coverage
|
$10,000,000
|
$10,000,000
|
$10,000,000
|
|
Expiration
date
|
June 30, 2020
|
June 30, 2019
|
June
30, 2019
|
|
|
|
|
|
|
Personal
Umbrella
|
|
|
|
|
Quota
share treaty:
|
|
|
|
|
Percent
ceded - first $1,000,000 of coverage
|
90%
|
90%
|
90%
|
|
Percent
ceded - excess of $1,000,000 dollars of coverage
|
100%
|
100%
|
100%
|
|
Risk
retained
|
$100,000
|
$100,000
|
$100,000
|
|
Total
reinsurance coverage per occurrence
|
$4,900,000
|
$4,900,000
|
$4,900,000
|
|
Losses
per occurrence subject to quota share reinsurance
coverage
|
$5,000,000
|
$5,000,000
|
$5,000,000
|
|
Expiration
date
|
June 30, 2020
|
June 30, 2019
|
June 30, 2018
|
|
|
|
|
|
|
Commercial Lines:
|
|
|
|
|
General
liability commercial policies
|
|
|
|
|
Quota
share treaty
|
None
|
None
|
None
|
|
Risk
retained
|
$750,000
|
$750,000
|
$750,000
|
|
Excess
of loss coverage above risk retained
|
$3,750,000
|
$3,750,000
|
$3,750,000
|
|
|
in excess of
|
in excess of
|
in excess of
|
|
|
$750,000
|
$750,000
|
$750,000
|
|
Total
reinsurance coverage per occurrence
|
$3,750,000
|
$3,750,000
|
$3,750,000
|
|
Losses
per occurrence subject to reinsurance coverage
|
$4,500,000
|
$4,500,000
|
$4,500,000
|
|
|
|
|
|
|
Commercial
Umbrella
|
|
|
|
|
Quota
share treaty:
|
None
|
|
|
|
Percent
ceded - first $1,000,000 of coverage
|
|
90%
|
90%
|
|
Percent
ceded - excess of $1,000,000 of coverage
|
|
100%
|
100%
|
|
Risk
retained
|
|
$100,000
|
$100,000
|
|
Total
reinsurance coverage per occurrence
|
|
$4,900,000
|
$4,900,000
|
|
Losses
per occurrence subject to quota share reinsurance
coverage
|
|
$5,000,000
|
$5,000,000
|
|
Expiration
date
|
|
June 30, 2019
|
June 30, 2018
|
|
|
|
|
|
|
Catastrophe Reinsurance:
|
|
|
|
|
Initial
loss subject to personal lines quota share treaty
|
None
|
$5,000,000
|
$5,000,000
|
|
Risk
retained per catastrophe occurrence (2)
|
$7,500,000
|
$4,500,000
|
$4,000,000
|
|
Catastrophe
loss coverage in excess of quota share coverage (3)
|
$602,500,000
|
$445,000,000
|
$315,000,000
|
|
Reinstatement
premium protection (4)(5)(6)
|
Yes
|
Yes
|
Yes
|
(1)
For
personal lines, includes the addition of an automatic facultative
facility allowing KICO to obtain homeowners single risk coverage up
to $10,000,000 in total insured value, which covers direct losses
from $3,500,000 to $10,000,000.
(2)
Plus
losses in excess of catastrophe coverage.
(3)
Catastrophe
coverage is limited on an annual basis to two times the per
occurrence amounts. Duration of 168 consecutive hours for a
catastrophe occurrence from windstorm, hail, tornado, hurricane and
cyclone.
(4)
Effective
July 1, 2017, reinstatement premium protection for $145,000,000 of
catastrophe coverage in excess of $5,000,000.
(5)
Effective
July 1, 2018, reinstatement premium protection for $210,000,000 of
catastrophe coverage in excess of $5,000,000.
(6)
Effective
July 1, 2019, reinstatement premium protection for $292,500,000 of
catastrophe coverage in excess of $7,500,000.
25
The single maximum risks per occurrence to which the Company is
subject under the treaty year shown below are as
follows:
|
|
July 1, 2019 - June 30, 2020
|
|
|
Treaty
|
Range of Loss
|
Risk Retained
|
|
|
|
|
|
Personal Lines (1)
|
Initial $1,000,000
|
$1,000,000
|
|
|
$1,000,000 - $10,000,000
|
None(2)
|
|
|
Over $10,000,000
|
100%
|
|
|
|
|
|
Personal Umbrella
|
Initial $1,000,000
|
$100,000
|
|
|
$1,000,000 - $5,000,000
|
None
|
|
|
Over $5,000,000
|
100%
|
|
|
|
|
|
Commercial Lines
|
Initial $750,000
|
$750,000
|
|
|
$750,000 - $4,500,000
|
None(3)
|
|
|
Over $4,500,000
|
100%
|
|
|
|
|
|
Catastrophe (4)
|
Initial $7,500,000
|
$7,500,000
|
|
|
$7,500,000 - $610,000,000
|
None
|
|
|
Over $610,000,000
|
100%
|
(1)
Personal
lines quota share treaty was eliminated effective July 1, 2019. The
2017/2019 Treaty expired on a run-off basis.
(2)
Covered
by excess of loss treaties up to $3,500,000 and by facultative
facility from $3,500,000 to $10,000,000.
(3)
Covered by excess
of loss treaties.
(4)
Catastrophe
coverage is limited on an annual basis to two times the per
occurrence amounts.
The single maximum risks per occurrence to which the Company is
subject under the treaties effective July 1, 2018 and 2017 are as
follows:
|
|
July 1, 2018 - June 30, 2019
|
July 1, 2017 - June 30, 2018
|
||
|
Treaty
|
Range of Loss
|
Risk Retained
|
Range of Loss
|
Risk Retained
|
|
Personal Lines (1)
|
Initial $1,000,000
|
$900,000
|
Initial $1,000,000
|
$800,000
|
|
|
$1,000,000 - $10,000,000
|
None(2)
|
$1,000,000 - $10,000,000
|
None(2)
|
|
|
Over $10,000,000
|
100%
|
Over $10,000,000
|
100%
|
|
|
|
|
|
|
|
Personal Umbrella
|
Initial $1,000,000
|
$100,000
|
Initial $1,000,000
|
$100,000
|
|
|
$1,000,000 - $5,000,000
|
None
|
$1,000,000 - $5,000,000
|
None
|
|
|
Over $5,000,000
|
100%
|
Over $5,000,000
|
100%
|
|
|
|
|
|
|
|
Commercial Lines
|
Initial $750,000
|
$750,000
|
Initial $750,000
|
$750,000
|
|
|
$750,000 - $4,500,000
|
None(3)
|
$750,000 - $4,500,000
|
None(3)
|
|
|
Over $4,500,000
|
100%
|
Over $4,500,000
|
100%
|
|
|
|
|
|
|
|
Commercial Umbrella
|
Initial $1,000,000
|
$100,000
|
Initial $1,000,000
|
$100,000
|
|
|
$1,000,000 - $5,000,000
|
None
|
$1,000,000 - $5,000,000
|
None
|
|
|
Over $5,000,000
|
100%
|
Over $5,000,000
|
100%
|
|
|
|
|
|
|
|
Catastrophe (4)
|
Initial $5,000,000
|
$4,500,000
|
Initial $5,000,000
|
$4,000,000
|
|
|
$5,000,000 - $450,000,000
|
None
|
$5,000,000 - $320,000,000
|
None
|
|
|
Over $450,000,000
|
100%
|
Over $320,000,000
|
100%
|
(1)
Treaty
for July 1, 2017 – June 30, 2018 and July 1, 2018 –
June 30, 2019 is a two-year treaty with expiration date of June 30,
2019.
(2)
Covered
by excess of loss treaties up to $3,500,000 and by facultative
facility from $3,500,000 to $10,000,000.
(3)
Covered by excess
of loss treaties.
(4)
Catastrophe
coverage is limited on an annual basis to two times the per
occurrence amounts.
The Company’s reinsurance program has been structured to
enable the Company to grow its premium volume while maintaining
regulatory capital and other financial ratios generally within or
below the expected ranges used for regulatory oversight purposes.
The reinsurance program also provides income as a result of ceding
commissions earned pursuant to the quota share reinsurance
contracts. The Company’s participation in reinsurance
arrangements does not relieve the Company of its obligations to
policyholders.
26
Ceding Commission Revenue
The Company earns ceding commission revenue under its quota share
reinsurance agreements based on: (i) a fixed provisional commission
rate at which provisional ceding commissions are earned, and (ii) a
sliding scale of commission rates and ultimate treaty year loss
ratios on the policies reinsured under each of these agreements
based upon which contingent ceding commissions are earned. The
sliding scale includes minimum and maximum commission rates in
relation to specified ultimate loss ratios. The commission rate and
contingent ceding commissions earned increases when the estimated
ultimate loss ratio decreases and, conversely, the commission rate
and contingent ceding commissions earned decreases when the
estimated ultimate loss ratio increases.
The Company’s estimated ultimate treaty year loss ratios (the
“Loss Ratio(s)”) for treaties in effect during the nine
months ended September 30, 2019 are attributable to contracts under
the 2017/2019 Treaty for the 2018/2019 Treaty Year, which expired
on June 30, 2019 and was not renewed. The Loss Ratios for treaties
in effect for the three months ended September 30, 2018 are
attributable to contracts under the 2017/2019 Treaty for the
2018/2019 Treaty Year. The Loss Ratios for treaties in effect for
the nine months ended September 30, 2018 are attributable to
contracts under the 2017/2019 Treaty for both the 2017/2018 Treaty
Year and the 2018/2019 Treaty Year.
Treaty in effect during the three months and nine months ended
September 30, 2019
There
was no current quota share treaty in effect during the three months
ended September 30, 2019, and therefore no current contingent
commission adjustment was recorded for the three months ended
September 30, 2019.Under the 2017/2019 Treaty, the Company received
an upfront fixed provisional rate that was only subject to a
sliding scale contingent adjustment based upon Loss Ratio for the
2017/2018 Treaty Year (“Loss Period”). Under this
arrangement, the Company earned provisional ceding commissions that
are subject to later adjustment dependent on changes to the
estimated Loss Period Loss Ratio for the 2017/2019 Treaty. The
Company’s Loss Period Loss Ratios attributable to the
2017/2019 Treaty reached the maximum contractual level during the
six months ended June 30, 2018, and therefore no contingent
commission adjustment was recorded for the nine months ended
September 30, 2019.
Treaties in effect for the three months and nine months ended
September 30, 2018
Under
the 2017/2019 Treaty, the Company received an upfront fixed
provisional rate that was only subject to a sliding scale
contingent adjustment based upon Loss Ratio for the 2017/2018
Treaty Year (“Loss Period”). The Company’s Loss
Period Loss Ratios attributable to the 2017/2019 Treaty reached the
maximum contractual level during the six months ended June 30,
2018, and therefore no contingent commission adjustment was
recorded for the three months ended September 30, 2018. For the
nine months ended September 30, 2018, the Company incurred negative
contingent ceding commissions as a result of the Loss Period Loss
Ratio for the 2017/2019 Treaty, which reduced contingent ceding
commissions earned.
In addition to the treaties that were in effect during the three
months and nine months ended September 30, 2019 and 2018, the Loss
Ratios from prior years’ treaties are subject to change as
incurred losses from those periods increase or decrease, resulting
in an increase or decrease in the commission rate and contingent
ceding commissions earned.
Ceding commission revenue consists of the following:
|
|
Three
months ended
|
Nine
months ended
|
||
|
|
September
30,
|
September
30,
|
||
|
|
2019
|
2018
|
2019
|
2018
|
|
|
|
|
|
|
|
Provisional
ceding commissions earned
|
$1,320,069
|
$1,255,034
|
$4,001,294
|
$5,468,314
|
|
Contingent
ceding commissions earned
|
(290,487)
|
(210,505)
|
(1,018,334)
|
(1,037,459)
|
|
|
$1,029,582
|
$1,044,529
|
$2,982,960
|
$4,430,855
|
Provisional ceding commissions are settled monthly. Balances due
from reinsurers for contingent ceding commissions on quota share
treaties are settled annually based on the Loss Ratio of each
treaty year that ends on June 30. As discussed above,
the Loss Ratios from prior
years’ treaties are subject to change as incurred losses from
those periods develop, resulting in an increase or decrease in the
commission rate and contingent ceding commissions earned. As of
September 30, 2019 and December 31, 2018, net contingent ceding
commissions payable to reinsurers under all treaties was
approximately $3,060,000 and $1,581,000, respectively, which is
recorded in reinsurance balances payable on the accompanying
condensed consolidated balance sheets.
Commercial Lines of Business
In July 2019, the Company made the decision that it will no longer
underwrite Commercial Lines risks. These include Business Owners,
Artisans (“CraftPak”), Special Multi-Peril, and
Commercial Umbrella policies. The Company had 6,793 commercial
lines policies in force as of September 30, 2019 and approximately
$12,179,000 in earned premiums for the nine months ended September
30, 2019. As of June 30, 2019 the Company had 7,770 commercial
lines policies in force.
For the nine months ended September 30, 2019, these policies
represented approximately 12% of net premiums earned. As of
September 30, 2019, claims from these commercial lines represent
46% of loss and loss adjustment expense reserves net of reinsurance
recoverables. In force policies for these lines will be non-renewed
at the end of their current annual terms. All existing inforce
Commercial Lines policies will expire by September 30,
2020.
27
Note 7 – Debt
Federal Home Loan Bank
In July
2017, KICO became a member of, and invested in, the Federal Home
Loan Bank of New York (“FHLBNY”). The aggregate
investment in dividend bearing common stock was $15,180 as of
September 30, 2019. FHLBNY members have access to a variety of
flexible, low cost funding through FHLBNY’s credit products,
enabling members to customize advances, which are to be fully
collateralized. Eligible collateral to pledge to FHLBNY includes
residential and commercial mortgage backed securities, along with
U.S. Treasury and agency securities. See Note 3 – Investments
for eligible collateral held in a designated custodian account
available for future advances. Advances are limited to 5% of
KICO’s net admitted assets as of the previous quarter and are
due and payable within one year of borrowing. The maximum allowable
advance as of September 30, 2019 was approximately $11,502,000.
Advances are limited to 90% of the amount of available collateral,
which was approximately $4,630,000 as of September 30, 2019. There
were no borrowings under this facility during the nine months ended
September 30, 2019.
Long-term Debt
On December 19, 2017, the Company issued $30 million of its 5.50%
Senior Unsecured Notes due December 30, 2022 (the
“Notes”) in an underwritten public offering. Interest
is payable semi-annually in arrears on June 30 and December 30 of
each year, which began on June 30, 2018 at the rate of 5.50%. The
net proceeds of the issuance were $29,121,630, net of discount of
$163,200 and transaction costs of $715,170, for an effective yield
of 5.67%. The balance of long-term debt as of September 30, 2019
and December 31, 2018 is as follows:
|
|
September
30,
|
December
31,
|
|
|
2019
|
2018
|
|
|
|
|
|
5.50%
Senior Unsecured Notes
|
$30,000,000
|
$30,000,000
|
|
Discount
|
(105,465)
|
(129,796)
|
|
Issuance
costs
|
(467,149)
|
(574,953)
|
|
Long-term
debt, net
|
$29,427,386
|
$29,295,251
|
The Notes are unsecured obligations of the Company and are not the
obligations of or guaranteed by any of the Company's subsidiaries.
The Notes rank senior in right of payment to any of the Company's
existing and future indebtedness that is by its terms expressly
subordinated or junior in right of payment to the Notes. The Notes
rank equally in right of payment to all of the Company's existing
and future senior indebtedness, but will be effectively
subordinated to any secured indebtedness to the extent of the
value of the collateral securing such secured indebtedness. In
addition, the Notes will be structurally subordinated to the
indebtedness and other obligations of the Company's subsidiaries.
The Company may redeem the Notes, at any time in whole or from time
to time in part, at the redemption price equal to the greater of:
(i) 100% of the principal amount of the Notes to be redeemed; and
(ii) the sum of the present values of the remaining scheduled
payments of principal and interest on the Notes to be redeemed that
would be due if the Notes matured on the applicable redemption date
(exclusive of interest accrued to the applicable redemption date)
discounted to the redemption date on a semi-annual basis at the
Treasury Rate, plus 50 basis points.
On
December 20, 2017, the Company used $25,000,000 of the net proceeds
from the offering to contribute capital to KICO in order to support
additional growth. The remainder of the net proceeds are being used
for general corporate purposes. A registration statement relating
to the debt issued in the offering was filed with the SEC, which
became effective on November 28, 2017.
Note 8 – Stockholders’ Equity
Dividends Declared and Paid
Dividends
declared and paid on common stock were $2,827,276 and $3,204,813
for the nine months ended September 30, 2019 and 2018,
respectively. The Company’s Board of Directors approved a
quarterly dividend on November 11, 2019 of $0.0625 per share
payable in cash on December 13, 2019 to stockholders of record as
of November 29, 2019 (see Note 13).
28
Stock Options
Effective
August 12, 2014, the Company adopted the 2014 Equity Participation
Plan (the “2014 Plan”) pursuant to which a maximum of
700,000 shares of Common Stock of the Company are authorized to be
issued pursuant to the grant of incentive stock options,
non-statutory stock options, stock appreciation rights, restricted
stock and stock bonuses. Incentive stock options granted under the
2014 Plan expire no later than ten years from the date of grant
(except no later than five years for a grant to a 10% stockholder).
The Board of Directors or the Compensation Committee determines the
expiration date with respect to non-statutory stock options and the
vesting provisions for restricted stock granted under the 2014
Plan.
The
results of operations for the three months ended September 30, 2019
and 2018 include stock-based compensation expense related to the
2014 Plan totaling approximately $19,800 and $1,000, respectively.
The results of operations for the nine months ended September
30, 2019 and 2018 include
stock-based compensation expense related to stock options totaling
approximately $20,800 and $5,000, respectively. Stock-based
compensation expense related to stock options is net of estimated
forfeitures of approximately 17% for the three months and nine
months ended September 30, 2019 and 2018. Such amounts have been
included in the condensed consolidated statements of operations and
comprehensive income (loss) within other operating
expenses.
Stock-based
compensation expense for the nine months ended September 30, 2019
and 2018 is the estimated fair value of options granted, amortized
on a straight-line basis over the requisite service period, for the
entire portion of the award less an estimate for anticipated
forfeitures. The Company uses the “simplified” method
to estimate the expected term of the options because the
Company’s historical share option exercise experience does
not provide a reasonable basis upon which to estimate expected
term. The weighted average estimated fair value of stock options
granted during the nine months ended September 30, 2019 was $1.91
per share. No options were granted during the nine months September
30, 2018. The fair value of stock options at the grant date was
estimated using the Black-Scholes option-pricing model. The
following weighted average assumptions were used for grants during
the following periods:
|
|
Nine
months ended
|
|
|
|
September
30,
|
|
|
|
2019
|
2018
|
|
|
|
|
|
Dividend
Yield
|
2.87%
|
na
|
|
Volatility
|
36.11%
|
na
|
|
Risk-Free
Interest Rate
|
1.61%
|
na
|
|
Expected
Life
|
3.25 years
|
na
|
The
Black-Scholes Option Valuation Model was developed for use in
estimating the fair value of traded options, which have no vesting
restrictions and are fully transferable. In addition, option
valuation models require the input of highly subjective assumptions
including the expected stock price volatility. Because the
Company’s stock options have characteristics significantly
different from those of traded options, and because changes in the
subjective input assumptions can materially affect the fair value
estimate, in management's opinion, the existing models do not
necessarily provide a reliable single measure of the fair value of
our stock options.
A
summary of stock option activity under the Company’s 2014
Plan for the nine months ended September 30, 2019 is as
follows:
|
Stock
Options
|
Number
of Shares
|
Weighted
Average Exercise Price per Share
|
Weighted
Average Remaining Contractual Term
|
Aggregate
Intrinsic Value
|
|
|
|
|
|
|
|
Outstanding
at January 1, 2019
|
37,500
|
$8.36
|
2.24
|
$349,950
|
|
|
|
|
|
|
|
Granted
|
50,000
|
$8.72
|
|
$-
|
|
Exercised
|
(3,000)
|
$7.85
|
|
$6,270
|
|
Forfeited
|
(2,500)
|
$7.85
|
2.04
|
$13,588
|
|
|
|
|
|
|
|
Outstanding
at September 30, 2019
|
82,000
|
$8.61
|
3.63
|
$11,390
|
|
|
|
|
|
|
|
Vested
and Exercisable at September 30, 2019
|
50,000
|
$8.45
|
2.41
|
$15,075
|
The
aggregate intrinsic value of options outstanding and options
exercisable at September 30, 2019 is calculated as the difference
between the exercise price of the underlying options and the market
price of the Company’s Common Stock for the options that had
exercise prices that were lower than the $8.52 closing price of the
Company’s Common Stock on September 30, 2019. The total intrinsic value of options exercised
during the nine months ended September 30, 2019 was $6,270,
determined as of the date of exercise. The total intrinsic value of
options forfeited during the nine months ended September 30, 2019
was $13,588, determined as of the date of
forfeiture.
Participants in the 2014 Plan may exercise their outstanding vested
options, in whole or in part, by having the Company reduce the
number of shares otherwise issuable by a number of shares having a
fair market value equal to the exercise price of the option being
exercised (“Net Exercise”), or by exchanging a number
of shares owned for a period of greater than one year having a fair
market value equal to the exercise price of the option being
exercised (“Share Exchange”). The Company
received cash proceeds of $23,552 from the exercise of options for
the purchase of 3,000 shares of Common Stock during the nine months
ended September 30, 2019. The Company received cash proceeds of
$74,139 from the exercise of options for the purchase of 12,750
shares of Common Stock during the nine months ended September 30,
2018. The Company received 7,855 shares from the exercise of
options under a Share Exchange for the purchase of 30,000 shares of
Common Stock during the nine months ended September 30, 2018. The
remaining 132,500 options exercised during the nine months ended
September 30, 2018 were Net Exercises, resulting in the issuance of
54,231 shares of Common Stock.
As of
September 30, 2019, the fair value of unamortized compensation cost
related to unvested stock option awards was approximately $59,000.
Unamortized compensation cost as of September 30, 2019 is expected
to be recognized over a remaining weighted-average vesting period
of 1.99 years.
As of
September 30, 2019, there were 390,338 shares reserved for grants
under the 2014 Plan.
29
Restricted Stock Awards
A summary of the restricted common stock activity under the
Company’s 2014 Plan for the nine months ended
September 30, 2019 is as
follows:
|
Restricted
Stock Awards
|
Shares
|
Weighted Average Grant Date Fair Value per
Share
|
Aggregate Fair Value
|
|
|
|
|
|
|
Balance
at January 1, 2019
|
120,499
|
$17.66
|
$2,129,175
|
|
|
|
|
|
|
Granted
|
120,586
|
$15.51
|
$1,870,487
|
|
Vested
|
(44,410)
|
$17.18
|
$(763,103)
|
|
Forfeited
|
(10,459)
|
$15.79
|
$(165,171)
|
|
|
|
|
|
|
Balance
at September 30, 2019
|
186,216
|
$16.47
|
$3,071,388
|
Fair value was calculated using the closing price of the
Company’s Common Stock on the grant date. For the three
months ended September 30, 2019 and 2018, stock-based compensation
for these grants was approximately $388,000 and $196,000,
respectively, which is included in other operating expenses on the
accompanying condensed consolidated statements of operations and
comprehensive income (loss). For the nine months ended September
30, 2019 and 2018, stock-based compensation for these grants of
approximately $1,096,000 and $477,000, respectively, for these
grants is included in other operating expenses in the condensed
consolidated statements of operations and comprehensive income
(loss). These amounts reflect the Company’s accounting
expense and do not correspond to the actual value that will be
recognized by the directors, executives and employees.
30
Note 9 – Income Taxes
The Company files a consolidated U.S. federal income tax return
that includes all wholly owned subsidiaries. State tax returns are
filed on a consolidated or separate return basis depending on
applicable laws. The Company records adjustments related to prior
years’ taxes during the period when they are identified,
generally when the tax returns are filed. The effect of
these adjustments on the current and prior periods (during which
the differences originated) is evaluated based upon quantitative
and qualitative factors and are considered in relation to the
consolidated financial statements taken as a whole for the
respective periods.
Deferred tax assets and liabilities are determined using the
enacted tax rates applicable to the period the temporary
differences are expected to be recovered. Accordingly, the current
period income tax provision can be affected by the enactment of new
tax rates. The net deferred income taxes on the balance sheets
reflect temporary differences between the carrying amounts of the
assets and liabilities for financial reporting purposes and income
tax purposes, tax effected at various rates depending on whether
the temporary differences are subject to federal taxes, state
taxes, or both.
Significant components of the Company’s deferred tax assets
and liabilities are as follows:
|
|
September
30,
|
December
31,
|
|
|
2019
|
2018
|
|
|
|
|
|
Deferred
tax asset:
|
|
|
|
Net
operating loss carryovers (1)
|
$2,418,344
|
$90,438
|
|
Claims
reserve discount
|
526,114
|
343,905
|
|
Unearned
premium
|
3,735,054
|
3,145,682
|
|
Deferred
ceding commission revenue
|
384,063
|
564,202
|
|
Other
|
680,204
|
383,733
|
|
Total
deferred tax assets
|
7,743,779
|
4,527,960
|
|
|
|
|
|
Deferred
tax liability:
|
|
|
|
Investment
in KICO (2)
|
759,543
|
759,543
|
|
Deferred
acquisition costs
|
4,303,229
|
3,760,625
|
|
Intangibles
|
105,000
|
140,700
|
|
Depreciation
and amortization
|
515,487
|
664,194
|
|
Net
unrealized gains (losses) of securities - available for
sale
|
1,520,225
|
(1,151,335)
|
|
Total
deferred tax liabilities
|
7,203,484
|
4,173,727
|
|
|
|
|
|
Net
deferred income tax asset
|
$540,295
|
$354,233
|
31
(1)
The deferred tax assets from net operating loss carryovers
(“NOL”) are as follows:
|
|
September
30,
|
December
31,
|
|
|
Type of NOL
|
2019
|
2018
|
Expiration
|
|
|
|
|
|
|
Federal
only, current year
|
$2,347,962
|
$-
|
None
|
|
Amount
subject to Annual Limitation, federal only
|
-
|
2,100
|
December
31, 2019
|
|
Total
federal only
|
2,347,962
|
2,100
|
|
|
|
|
|
|
|
State
only (A)
|
1,454,929
|
1,305,365
|
December
31, 2039
|
|
Valuation
allowance
|
(1,384,547)
|
(1,217,027)
|
|
|
State
only, net of valuation allowance
|
70,382
|
88,338
|
|
|
|
|
|
|
|
Total
deferred tax asset from net operating loss carryovers
|
$2,418,344
|
$90,438
|
|
(A) Kingstone generates operating losses for state
purposes and has prior year NOLs available. The state NOL as of
September 30, 2019 and December 31, 2018 was approximately
$22,384,000 and $20,083,000, respectively. KICO is not subject to state
income taxes. KICO’s state tax obligations are paid through a
gross premiums tax, which is included in the condensed
consolidated statements of operations and comprehensive income
(loss) within other underwriting expenses. A valuation allowance has been recorded due to
the uncertainty of generating enough state taxable income to
utilize 100% of the available state NOLs over their remaining
lives, which expire between 2027 and 2039.
(2)
Deferred
tax liability – Investment in KICO
On July 1, 2009, the Company completed the acquisition of 100% of
the issued and outstanding common stock of KICO (formerly known as
Commercial Mutual Insurance Company (“CMIC”)) pursuant
to the conversion of CMIC from an advance premium cooperative to a
stock property and casualty insurance company. Pursuant to the plan
of conversion, the Company acquired a 100% equity interest in KICO,
in consideration for the exchange of $3,750,000 principal amount of
surplus notes of CMIC. In addition, the Company forgave all accrued
and unpaid interest on the surplus notes as of the date of
conversion. As of the date of acquisition, unpaid accrued interest
on the surplus notes along with the accretion of the discount on
the original purchase of the surplus notes totaled $2,921,319
(together “Untaxed Interest”). As of the date of
acquisition, the deferred tax liability on the Untaxed Interest was
$1,169,000. A temporary difference with an indefinite life exists
when the parent has a lower carrying value of its subsidiary for
income tax purposes. The deferred tax liability was reduced to
$759,543 upon the reduction of federal income tax rates as of
December 31, 2017. The Company is required to maintain its deferred
tax liability of $759,543 related to this temporary difference
until the stock of KICO is sold, or the assets of KICO are sold or
KICO and the parent are merged.
In assessing the valuation of deferred tax assets, the Company
considers whether it is more likely than not that some portion or
all of the deferred tax assets will not be realized. The ultimate
realization of deferred tax assets is dependent upon the generation
of future taxable income during the periods in which those
temporary differences become deductible. No valuation allowance
against deferred tax assets has been established, except for NOL
limitations, as the Company believes it is more likely than not the
deferred tax assets will be realized based on the historical
taxable income of KICO, or by offset to deferred tax
liabilities.
The Company had no material unrecognized tax benefit and no
adjustments to liabilities or operations were required. There were
no interest or penalties related to income taxes that have been
accrued or recognized as of and for the nine months ended September
30, 2019 and 2018. If any had been recognized these would have been
reported in income tax expense.
Generally, taxing authorities may examine the Company’s tax
returns for the three years from the date of filing. The
Company’s tax returns for the years ended December 31, 2015
through December 31, 2018 remain subject to examination. The
Company’s federal income tax return for the year ended
December 31, 2016 has been examined by the Internal Revenue Service
and was accepted as filed.
32
Note
10 –Earnings/(Loss) Per Common Share
Basic
net earnings/(loss) per common share is computed by dividing
income/(loss) available to common shareholders by the
weighted-average number of common shares outstanding. Diluted
earnings/(loss) per common share reflect, in periods in which they
have a dilutive effect, the impact of common shares issuable upon
exercise of stock options as well as non-vested restricted stock
awards. The computation of diluted earnings/(loss) per common share
excludes those options with an exercise price in excess of the
average market price of the Company’s common shares during
the periods presented.
The
computation of diluted earnings/(loss) per common share excludes
outstanding options in periods where the exercise of such options
would be anti-dilutive. For the three months and nine months ended
September 30, 2019, no options were included in the computation of
diluted earnings/(loss) per common share as they would have been
anti-dilutive for the relevant periods and, as a result, the
weighted average number of common shares used in the calculation of
diluted earnings per common share has not been adjusted for the
effect of such options.
The
reconciliation of the weighted average number of common shares used
in the calculation of basic and diluted earnings/(loss) per common
share follows:
|
|
Three
months ended
|
Nine
months ended
|
||
|
|
September
30,
|
September
30,
|
||
|
|
2019
|
2018
|
2019
|
2018
|
|
|
|
|
|
|
|
Weighted
average number of shares outstanding
|
10,779,641
|
10,681,329
|
10,769,817
|
10,672,084
|
|
|
|
|
|
|
|
Effect of dilutive securities, common share
equivalents
|
|
|
||
|
Stock
options
|
-
|
98,749
|
-
|
100,628
|
|
Restricted
stock awards
|
-
|
11,045
|
-
|
7,878
|
|
|
|
|
|
|
|
Weighted average number of shares outstanding,
|
|
|
|
|
|
used
for computing diluted earnings per share
|
10,779,641
|
10,791,123
|
10,769,817
|
10,780,590
|
Note 11 - Commitments and Contingencies
Litigation
From time to time, the Company is involved in various legal
proceedings in the ordinary course of business. For example, to the
extent a claim is asserted by a third party in a lawsuit against
one of the Company’s insureds covered by a particular policy,
the Company may have a duty to defend the insured party against the
claim. These claims may relate to bodily injury, property damage or
other compensable injuries as set forth in the policy. Such
proceedings are considered in estimating the liability for loss and
LAE expenses.
On June 12, 2019, Phillip Woolgar filed a suit naming the Company
and certain present or former officers and directors as defendants
in a putative class action captioned Woolgar v. Kingstone Companies
et al., 19 cv 05500 (S.D.N.Y.),
asserting claims under Section 10(b) of the Exchange Act and SEC
Rule 10b-5 promulgated thereunder and Section 20(a) of the Exchange
Act. Plaintiff seeks to represent a class of persons or
entities that purchased Kingstone securities between March 14,
2018, and April 29, 2019, and alleges violations of the federal
securities law in connection with the Company’s April 29,
2019 announcement regarding losses related to winter catastrophe
events. The lawsuit alleges that the Company failed to
disclose that it did not adequately follow industry best practices
related to claims handling and thus did not record sufficient claim
reserves, and that as a result, Defendants’ positive
statements about the Company’s business, operations and
prospects misled investors. Plaintiff seeks, among other
things, an undetermined amount of money damages. The Company
believe the lawsuit to be without merit. The Company has not
established an accrual for this matter as a loss is not considered
to be probable and reasonably estimable. It is the opinion of
management that facts known at the present time do not indicate
that such litigation will have a material adverse impact on the
Company’s results of operations, financial position, or cash
flows.
33
Office Lease
The Company enters into lease agreements for real estate that is
primarily used for office space in the ordinary course of business.
These leases are accounted for as operating leases, whereby lease
expense is recognized on a straight-line basis over the term of the
lease. See Note 2 - Accounting Policies for additional information
regarding the accounting for leases.
The Company is a party to a non-cancellable operating lease, dated
March 27, 2015, for its office facility for KICO located in Valley
Stream, New York expiring March 31, 2024.
On July 8, 2019, the Company entered into a lease agreement for an
additional office facility for Cosi located in Valley Stream, New
York under a non-cancelable operating lease. In addition to the
base rental costs, occupancy lease agreements generally provide for
rent escalations resulting from increased assessments from real
estate taxes and other charges. The lease commencement date will be
determined upon the completion of landlord provided construction,
which the Company expects to be on or about November 15, 2019. The
lease has a term of seven years and two months expiring December
31, 2026.
In addition to the base rental costs, occupancy lease agreements
generally provide for rent escalations resulting from increased
assessments from real estate taxes and other charges. This lease is
accounted for as an operating lease, whereby lease expense is
recognized on a straight-line basis over the term of the
lease.
Additional information regarding the Company’s office
operating lease (exclusive of the Cosi lease facility discussed
above, which has not yet commenced) is as follows:
|
|
Three months
ended
|
Nine months
ended
|
|
Lease cost
|
September 30,
2019
|
September 30,
2019
|
|
Operating
lease
|
$41,342
|
$124,026
|
|
Short-term
leases
|
-
|
-
|
|
Total
lease cost (1)
|
$41,342
|
$124,026
|
|
|
|
|
|
Other information on operating
lease
|
|
|
| Cash payments included in the measurement of lease | ||
|
liability
reported in operating cash flows
|
$42,827
|
$127,034
|
|
Discount
rate
|
5.50%
|
5.50%
|
|
Remaining
lease term in years
|
5 years
|
5 years
|
(1)
Included in the condensed consolidated
statements of operations and comprehensive income (loss) within
other underwriting
expenses.
34
The following table presents the contractual maturities of the
Company’s lease liabilities as of September 30,
2019:
|
For the Year
|
|
|
Ending
|
|
|
December 31,
|
Total
|
|
Remainder
of 2019
|
$42,827
|
|
2020
|
255,624
|
|
2021
|
264,571
|
|
2022
|
273,831
|
|
2023
|
283,415
|
|
Thereafter
|
333,654
|
|
Total
undiscounted lease payments
|
1,453,922
|
|
Less:
present value adjustment
|
230,834
|
|
Operating
lease liability
|
$1,223,088
|
Rent expense for the three months ended September 30, 2019 and 2018
amounted to $41,342 for each period. Rent expense for the nine
months ended September 30, 2019 and 2018 amounted to $124,026 for
each period. Rent expense is included in the accompanying
condensed consolidated statements of operations and comprehensive
income (loss) within other
underwriting expenses.
Employment Agreements
Dale A. Thatcher
Effective
July 19, 2019 (the “Separation Date”), Dale A. Thatcher
retired and resigned his positions as Chief Executive Officer and
President of the Company and KICO. At such time, he also
resigned his positions on the Board of Directors of each of the
Company and KICO. Effective upon Mr. Thatcher’s
separation from employment, the Board appointed Barry B. Goldstein,
former Chief Executive Officer and Executive Chairman of the Board
of Directors, to the position of Chief Executive Officer and
President of each of the Company and KICO. Mr. Goldstein previously
served as Chief Executive Officer and President of the Company from
March 2001 through December 31, 2018, and as Chief Executive
Officer and President of KICO from January 2012 through December
31, 2018.
In
connection with his separation from employment, each of the Company
and KICO entered into an Agreement and General Release (the
“Separation Agreement”) with Mr. Thatcher.
Pursuant to the Separation Agreement, the Company and KICO shall
collectively provide the following payments and benefits to Mr.
Thatcher in full satisfaction of all payments and benefits and
other amounts due to him under the terms of the existing employment
agreements upon his separation from employment: (i) an amount equal
to $381,111 (representing the amount of base salary he would have
received had he remained employed through March 31, 2020), (ii) an
amount equal to $5,000 in full satisfaction for any bonus payments
payable under the existing employment agreements, (iii) continuing
group health coverage commencing on the Separation Date and ending
on March 31, 2020, and (iv) continued vesting of all previously
granted but unvested stock awards as of the Separation Date (Mr.
Thatcher shall not be entitled to any further grants of stock
awards after the Separation Date). In addition, the Company
and KICO agreed to provide Mr. Thatcher with a severance payment of
$20,000 in consideration for a release. As required by the
employment agreements, Mr. Thatcher covenanted that, for a period
of three years following the Separation Date, he shall not accept
any operating executive role with another property and casualty
insurance company.
Barry Goldstein, President, Chief Executive Officer and Executive
Chairman of the Board
On October 14, 2019, the Company and Barry B. Goldstein, the
Company’s President, Chief Executive Officer and Executive
Chairman of the Board, entered into a Second Amended and Restated
Employment Agreement (the “Amended Employment
Agreement”). The Amended Employment Agreement is effective as
of January 1, 2020 and expires on December 31, 2022. The Amended
Employment Agreement extends the expiration date of the employment
agreement in effect for Mr. Goldstein from December 31, 2021 to
December 31, 2022.
35
Pursuant to the Amended Employment Agreement, Mr. Goldstein is
entitled to receive an annual base salary of $500,000 and an annual
bonus equal to 6% of the Company’s consolidated income from
operations before taxes, exclusive of the Company’s
consolidated net investment income (loss), net unrealized gains
(losses) on equity securities and net realized gains (losses) on
investments, up to a maximum of 2.5 times his base salary. In
addition, pursuant to the Amended Employment Agreement, Mr.
Goldstein is entitled to receive a long-term compensation award
(“LTC”) of between $945,000 and $2,835,000 based on a
specified minimum increase in the Company’s adjusted book
value per share (as defined in the Amended Employment Agreement) as
of December 31, 2022 as compared to December 31, 2019 (with the
maximum LTC payment being due if the average per annum increase is
at least 14%). Further, pursuant to the Amended Employment
Agreement, in the event that Mr. Goldstein’s employment is
terminated by the Company without cause or he resigns for good
reason (each as defined in the Amended Employment Agreement), Mr.
Goldstein would be entitled to receive his base salary, the 6%
bonus and the LTC payment for the remainder of the term. Mr.
Goldstein would be entitled, under certain circumstances, to a
payment equal to 3.82 times his then annual salary, the target LTC
payment of $1,890,000 and his accrued 6% bonus in the event of the
termination of his employment following a change of control of the
Company.
Pursuant to the Amended Employment Agreement, Mr. Goldstein will be
entitled to receive a grant, under the terms of the Company’s
2014 Plan, during January 2020, of a number of shares of restricted
stock determined by dividing $1,250,000 by the fair market value of
the Company’s common stock on the date of grant. The January
2020 grant will become vested with respect to one-third of the
award on each of the first and second anniversaries of the grant
date and on December 31, 2022 based on continued provision of
services on each vesting date. Also pursuant to the Amended
Employment Agreement, Mr. Goldstein will be entitled to receive a
grant, under the terms of the 2014 Plan, during January 2021, of a
number of shares of restricted stock determined by dividing
$1,500,000 by the fair market value of the Company’s common
stock on the date of grant. The January 2021 grant will become
vested with respect to one-half of the award on each of the first
anniversary of the grant date and on December 31, 2022 based on
continued provision of services on each vesting date. Further,
pursuant to the Amended Employment Agreement, Mr. Goldstein will be
entitled to receive a grant, under the terms of the 2014 Plan,
during each of 2020, 2021 and 2022, of a number of shares of
restricted stock determined by dividing $136,500 by the fair market
value of the Company’s common stock on the date of grant. The
2020 grant will become vested with respect to one-third of the
award on each of the first and second anniversaries of the grant
date and on December 31, 2022. The 2021 grant will become vested
with respect to one-half of the award on each of the first
anniversary of the grant date and on December 31, 2022. The 2022
grant will become vested on December 31, 2022.
Meryl Golden, Chief Operating Officer
On September 16, 2019, the Company and Meryl Golden entered into an
employment agreement (the “Golden Employment
Agreement”) pursuant to which Ms. Golden serves as the
Company’s Chief Operating Officer. Ms. Golden also
serves KICO’s Chief Operating Officer. The Golden Employment Agreement became effective
as of September 25, 2019 and expires on December 31,
2021.
Pursuant to the Golden Employment Agreement, Ms. Golden is entitled
to receive an annual salary of $500,000. The Golden Employment also
provides for the grant on the effective date of a five year option
for the purchase of 50,000 shares of the Company’s common
stock pursuant to the 2014 Plan. The options granted will vest in three equal
installments, with the first installment vesting on the grant date,
and the remaining installments vesting on the first and second
anniversaries following the grant date, subject to the terms of the
option grant agreement between the Company and Ms.
Golden.
Note 12 – Deferred Compensation Plan
On June
18, 2018, the Company adopted the Kingstone Companies, Inc.
Deferred Compensation Plan (the "Deferred Compensation Plan"). The
Deferred Compensation Plan is offered to a select group
(“Participants”), consisting of management and highly
compensated employees as a method of recognizing and retaining such
Participants. The Deferred Compensation Plan provides for eligible
Participants to elect to defer up to 75% of their base compensation
and up to 100% of bonuses and other compensation and to have such
deferred amounts deemed to be invested in specified investment
options. In addition to the Participant deferrals, the Company
may choose to make matching contributions to some or all of the
Participants in the Deferred Compensation Plan to the extent the
Participant did not receive the maximum matching or non-elective
contributions permissible under the Company’s 401(k) Plan due
to limitations under the Internal Revenue Code or the 401(k) Plan.
Participants may elect to receive payment of their account balances
in a single cash payment or in annual installments for a period of
up to ten years. The first payroll subject to the Deferred
Compensation Plan was in July 2018. The deferred compensation
liability as of September 30, 2019 and December 31, 2018 amounted
to $530,744 and $298,638, respectively, and is recorded in accounts
payable, accrued expenses and other liabilities in the accompanying
condensed consolidated balance sheets. The Company did not make any
voluntary contributions for the nine months ended September 30,
2019.
Note 13 – Subsequent Events
The
Company has evaluated events that occurred subsequent to September
30, 2019 through the date these
condensed consolidated financial statements were issued for matters
that required disclosure or adjustment in these condensed
consolidated financial statements.
Employment Agreements
See
Note 11 - Commitments and Contingencies.
Dividends Declared
On
November 11, 2019, the Company’s Board of Directors approved
a quarterly dividend of $0.0625 per share payable in cash on
December 13, 2019 to stockholders of record as of the close of
business on November 29, 2019 (see Note 8).
Capital Contribution to KICO
On
November 11, 2019, the Company’s Board of Directors approved
a $3,000,000 capital contribution to KICO, which is subject to
approval from the New York State Department of Financial
Services.
36
ITEM 2. MANAGEMENT’S
DISCUSSION AND ANALYSIS OF FINANCIAL CONDITION AND RESULTS OF
OPERATIONS.
Overview
We
offer property and casualty insurance products to individuals and
small businesses through our wholly owned subsidiary, Kingstone
Insurance Company (“KICO”). KICO’s insureds are
located primarily in downstate New York, consisting of New York
City and Long Island, although we are actively writing business in
New Jersey, Rhode Island, Massachusetts, and Connecticut. We are
licensed in the States of New York, New Jersey, Rhode Island,
Massachusetts, Pennsylvania, Connecticut, Maine, and New Hampshire.
For the three months and nine months ended September 30, 2019,
respectively, 84.0% and 86.8% of KICO’s direct written
premiums came from the New York policies.
In
addition, through our subsidiary, Cosi Agency, Inc.
(“Cosi”), a multi-state licensed general agency, we
access alternative distribution channels. Through Cosi, we have the
opportunity to partner with name-brand carriers and access
nationwide insurance agencies. See “Distribution
Channels” below for a discussion of our distribution
channels. Cosi receives commission revenue from KICO for the
policies it places with others and pays commissions to these
agencies. Cosi retains the profit between the commission revenue
received and the commission expense paid. Cosi revenue is included
in other income and Cosi related expenses are included in other
operating expenses. Cosi operations are not included in our
stand-alone insurance underwriting business and, accordingly, its
revenue and expenses are not included in the calculation of our
combined ratio as described below.
We
derive substantially all of our revenue from KICO, which includes
revenues from earned premiums, ceding commissions from quota share
reinsurance, net investment income generated from its portfolio,
and net realized gains and losses on investment securities. All of
KICO’s insurance policies are written for a one-year term.
Earned premiums represent premiums received from insureds, which
are recognized as revenue over the period of time that insurance
coverage is provided (i.e., ratably over the one-year life of the
policy). A significant period of time can elapse from the receipt
of insurance premiums to the payment of insurance claims. During
this time, KICO invests the premiums, earns investment income and
generates net realized and unrealized investment gains and losses
on investments. Our holding company earns investment income from
its cash holdings and may also generate net realized and unrealized
investment gains and losses on future investments.
Our
expenses include the insurance underwriting expenses of KICO and
other operating expenses. Insurance companies incur a significant
amount of their total expenses from losses incurred by
policyholders, which are referred to as claims. In settling these
claims, various loss adjustment expenses (“LAE”) are
incurred such as insurance adjusters’ fees and legal
expenses. In addition, insurance companies incur policy acquisition
costs. Policy acquisition costs include commissions paid to
producers, premium taxes, and other expenses related to the
underwriting process, including employees’ compensation and
benefits.
Other
operating expenses include our corporate expenses as a holding
company and operating expenses of Cosi. These corporate expenses
include legal and auditing fees, executive employment costs, and
other costs directly associated with being a public company. Cosi
operating expenses primarily include commissions paid to brokers,
employment costs, and consulting costs.
Product Lines
Our
product lines include the following:
Personal lines: Our
largest line of business is personal lines, consisting of
homeowners, dwelling fire, cooperative/condominium, renters, and
personal umbrella policies.
Commercial
lines: Through
July 2019, we offered businessowners policies, which consist
primarily of small business retail, service, and office risks, with
limited property exposures. We also wrote artisan’s liability
policies for small independent contractors with smaller sized
workforces. In addition, we wrote special multi-peril
policies for larger and more specialized businessowners risks,
including those with limited residential exposures. Further, we
offered commercial umbrella policies written above our supporting
commercial lines policies.
In May
2019, due to the poor performance of this line we placed a
moratorium on new commercial lines and new commercial umbrella
submissions while we further reviewed this business. In July
2019, due to the continuing poor performance of these lines, we
made the decision to no longer underwrite commercial lines or
commercial umbrella risks. In force policies for these lines will
be non-renewed at the end of their current annual terms. For the
nine months ended September 30, 2019, these policies represent
approximately 12% of net premiums earned and 47% of loss and LAE
reserves net of reinsurance recoverables. See discussion below
under “Additional Financial Information”.
Livery physical
damage: We
write for-hire vehicle physical damage only policies for livery and
car service vehicles and taxicabs. These policies insure only the
physical damage portion of insurance for such vehicles, with no
liability coverage included.
Other: We write
canine legal liability policies and have a small participation in
mandatory state joint underwriting associations.
37
Key Measures
We
utilize the following key measures in analyzing the results of our
insurance underwriting business:
Net loss ratio: The
net loss ratio is a measure of the underwriting profitability of an
insurance company’s business. Expressed as a percentage, this
is the ratio of net losses LAE incurred to net premiums
earned.
Net underwriting expense
ratio: The net underwriting expense ratio is a
measure of an insurance company’s operational efficiency in
administering its business. Expressed as a percentage, this is the
ratio of the sum of acquisition costs (the most significant being
commissions paid to our producers) and other underwriting expenses
less ceding commission revenue less other income to net premiums
earned.
Net combined
ratio: The net combined ratio is a measure of an
insurance company’s overall underwriting profit. This is the
sum of the net loss and net underwriting expense ratios. If the net
combined ratio is at or above 100 percent, an insurance company
cannot be profitable without investment income, and may not be
profitable if investment income is insufficient.
Underwriting income:
Underwriting income is net pre-tax income attributable to our
insurance underwriting business before investment activity. It
excludes net investment income, net realized gains from
investments, and depreciation and amortization (net premiums earned
less expenses included in combined ratio). Underwriting income is a
measure of an insurance company’s overall operating
profitability before items such as investment income, depreciation
and amortization, interest expense and income taxes.
Distribution Channels
During
2019, we initiated an alternative distribution program through Cosi
(“Alternative Distribution”). The goal of this program
is to enhance our personal lines distribution channel to include
nationally recognized name-brand carriers along with nationwide
call center and digital insurance agencies. While still in early
stages of development, the impact of this initiative can be
measured by the amount of new premiums written compared to total
premiums written, which includes renewals from our independent
agency network. The table below shows premiums written by
distribution channel for our homeowners and dwelling fire
components of personal lines.
|
|
Three
months ended
|
Nine
months ended
|
||
|
($
in thousands)
|
September
30, 2019
|
September
30, 2019
|
||
|
Direct
Written Pemiums
|
Amount
|
Percent
|
Amount
|
Percent
|
|
|
|
|
|
|
|
Core
Independent
|
$32,430
|
79.2%
|
$89,712
|
82.3%
|
|
Expansion
Independent (1)
|
7,188
|
17.6%
|
16,681
|
15.3%
|
|
Alternative
Distribution through Cosi
|
1,317
|
3.2%
|
2,560
|
2.3%
|
|
Total
|
$40,935
|
100.0%
|
$108,953
|
100.0%
|
(1)
Outside of New
York
(Percent components may not sum to totals due to
rounding)
For the
three months and nine months ended September 30, 2019, Alternative
Distribution made up 3.2% and 2.3%, respectively, of direct written
premiums for our homeowners and dwelling fire components of
personal lines.
Critical Accounting Policies and Estimates
Our
condensed consolidated financial statements include the accounts of
Kingstone Companies, Inc. and all majority-owned and controlled
subsidiaries. The preparation of financial statements in conformity
with GAAP requires our management to make estimates and assumptions
in certain circumstances that affect amounts reported in our
condensed consolidated financial statements and related notes. In
preparing these condensed consolidated financial statements, our
management has utilized information, including our past history,
industry standards, the current economic environment, and other
factors, in forming its estimates and judgments for certain amounts
included in the condensed consolidated financial statements, giving
due consideration to materiality. It is possible that the ultimate
outcome as anticipated by our management in formulating its
estimates in these financial statements may not materialize.
Application of the critical accounting policies involves the
exercise of judgment and use of assumptions as to future
uncertainties and, as a result, actual results could differ from
these estimates. In addition, other companies may utilize different
estimates, which may impact the comparability of our results of
operations to those of similar companies.
We
believe that the most critical accounting policies relate to the
reporting of reserves for loss and LAE, including losses that have
occurred but have not yet been reported prior to the reporting
date, amounts recoverable from reinsurers, deferred ceding
commission revenue, deferred policy acquisition costs, deferred
income taxes, the impairment of investment securities, intangible
assets and the valuation of stock-based compensation. See Note 2 to
the condensed consolidated financial statements - “Accounting
Policies” for information related to updated accounting
policies.
38
Consolidated Results of Operations
Nine Months Ended September 30, 2019 Compared to Nine Months Ended
September 30, 2018
The
following table summarizes the changes in the results of our
operations (in thousands) for the periods indicated:
|
|
Nine months ended September
30,
|
|||
|
($ in thousands)
|
2019
|
2018
|
Change
|
Percent
|
|
Revenues
|
|
|
|
|
|
Direct
written premiums
|
$128,333
|
$107,175
|
$21,158
|
19.7%
|
|
Assumed
written premiums
|
1
|
1
|
-
|
na%
|
|
|
128,334
|
107,176
|
21,158
|
19.7%
|
|
Ceded
written premiums
|
|
|
|
|
|
Ceded
to quota share treaties (1)
|
6,110
|
8,137
|
$(2,027)
|
(24.9)%
|
|
Ceded
to excess of loss treaties
|
1,219
|
988
|
231
|
23.4%
|
|
Ceded
to catastrophe treaties
|
13,585
|
10,284
|
3,301
|
32.1%
|
|
Total
ceded written premiums
|
20,914
|
19,409
|
1,505
|
7.8%
|
|
|
|
|
|
|
|
Net
written premiums
|
107,420
|
87,767
|
19,653
|
22.4%
|
|
|
|
|
|
|
|
Change
in unearned premiums
|
|
|
|
|
|
Direct
and assumed
|
(11,037)
|
(9,927)
|
(1,110)
|
11.2%
|
|
Ceded
to quota share treaties
|
(1,366)
|
(3,364)
|
1,998
|
(59.4)%
|
|
Change
in net unearned premiums
|
(12,403)
|
(13,291)
|
888
|
(6.7)%
|
|
|
|
|
|
|
|
Premiums
earned
|
|
|
|
|
|
Direct
and assumed
|
117,297
|
97,249
|
20,048
|
20.6%
|
|
Ceded
to reinsurance treaties
|
(22,280)
|
(22,773)
|
493
|
(2.2)%
|
|
Net
premiums earned
|
95,017
|
74,476
|
20,541
|
27.6%
|
|
Ceding
commission revenue
|
|
|
|
|
|
Excluding
the effect of catastrophes
|
2,983
|
4,890
|
(1,907)
|
(39.0)%
|
|
Effect
of catastrophes
|
-
|
(459)
|
459
|
n/a%
|
|
Total
ceding commission revenue
|
2,983
|
4,431
|
(1,448)
|
(32.7)%
|
|
Net
investment income
|
5,200
|
4,543
|
657
|
14.5%
|
|
Net
gains (losses) on investments
|
3,712
|
(278)
|
3,990
|
(1,435.3)%
|
|
Other
income
|
1,192
|
962
|
230
|
23.9%
|
|
Total
revenues
|
108,104
|
84,134
|
23,970
|
28.5%
|
|
Expenses
|
|
|
|
|
|
Loss
and loss adjustment expenses
|
|
|
|
|
|
Direct
and assumed:
|
|
|
|
|
|
Loss
and loss adjustment expenses excluding the effect of
catastrophes
|
72,682
|
42,603
|
30,079
|
70.6%
|
|
Losses
from catastrophes (2)
|
7,755
|
10,805
|
(3,050)
|
(28.2)%
|
|
Total
direct and assumed loss and loss adjustment expenses
|
80,437
|
53,408
|
27,029
|
50.6%
|
|
|
|
|
|
|
|
Ceded
loss and loss adjustment expenses:
|
|
|
|
|
|
Loss
and loss adjustment expenses excluding the effect of
catastrophes
|
8,041
|
6,984
|
1,057
|
15.1%
|
|
Losses
from catastrophes (2)
|
808
|
4,685
|
(3,877)
|
(82.8)%
|
|
Total
ceded loss and loss adjustment expenses
|
8,849
|
11,669
|
(2,820)
|
(24.2)%
|
|
|
|
|
|
|
|
Net
loss and loss adjustment expenses:
|
|
|
|
|
|
Loss
and loss adjustment expenses excluding the effect of
catastrophes
|
64,641
|
35,619
|
29,022
|
81.5%
|
|
Losses
from catastrophes (2)
|
6,947
|
6,120
|
827
|
13.5%
|
|
Net
loss and loss adjustment expenses
|
71,588
|
41,739
|
29,849
|
71.5%
|
|
|
|
|
|
|
|
Commission
expense
|
21,932
|
18,411
|
3,521
|
19.1%
|
|
Other
underwriting expenses
|
17,983
|
15,301
|
2,682
|
17.5%
|
|
Other
operating expenses
|
2,774
|
1,774
|
1,000
|
56.4%
|
|
Depreciation
and amortization
|
1,876
|
1,274
|
602
|
47.3%
|
|
Interest
expense
|
1,370
|
1,365
|
5
|
0.4%
|
|
Total
expenses
|
117,523
|
79,864
|
37,659
|
47.2%
|
|
|
|
|
|
|
|
(Loss)
income before taxes
|
(9,419)
|
4,269
|
(13,688)
|
(320.6)%
|
|
Income
tax (benefit) expense
|
(1,998)
|
296
|
(2,294)
|
(775.0)%
|
|
Net (loss) income
|
$(7,421)
|
$3,973
|
$(11,394)
|
(286.8)%
|
(1)
Effective July 1, 2018, we decreased the quota share ceding rate in
our personal lines quota share treaty from 20% to 10%. Effective
July 1, 2019, our personal lines 10% quota share treaty expired on
a run-off basis.
(2) The
nine months ended September 30, 2019 and 2018 includes catastrophe
losses, which are defined as losses from an event for which a
catastrophe bulletin and related serial number has been issued by
the Property Claims Services (PCS) unit of the Insurance Services
Office (ISO). PCS catastrophe bulletins are issued for events that
cause more than $25 million in total insured losses and affect a
significant number of policyholders and insurers.
39
|
|
Nine
months ended September 30,
|
|||
|
|
2019
|
2018
|
Percentage
Point Change
|
Percent
Change
|
|
|
|
|
|
|
|
Key ratios:
|
|
|
|
|
|
Net
loss ratio
|
75.3%
|
56.0%
|
19.3
|
34.5%
|
|
Net
underwriting expense ratio
|
37.8%
|
38.1%
|
(0.3)
|
(0.8)%
|
|
Net
combined ratio
|
113.1%
|
94.1%
|
19.0
|
20.2%
|
Direct Written Premiums
Direct written premiums during the nine months
ended September 30, 2019 (“Nine Months 2019”)
were $128,333,000 compared
to $107,175,000 during the nine
months ended September 30, 2018 (“Nine Months 2018”).
The increase of $21,158,000, or 19.7%, was primarily due to an
increase in policies in-force during Nine Months 2019 as compared
to Nine Months 2018. We wrote more new policies as a result of
continued demand for our products in the markets that we serve.
Policies in-force increased by 17.7% as of September 30, 2019
compared to September 30, 2018.
In
2017, we started writing homeowners’ policies in New Jersey
and Rhode Island. We began writing homeowners policies in
Massachusetts in 2018 and Connecticut in March of 2019. We refer to
our New York business as our “Core” business and the
business outside of New York as our “Expansion”
business. Direct written premiums from our Expansion business were
$16,900,000 in Nine Months 2019 compared to $5,919,000 in Nine
Months 2018.
Net Written Premiums and Net Premiums Earned
Our
personal lines quota share reinsurance treaties in effect for Nine
Months 2019 and Nine Months 2018 were covered under a treaty
covering a two-year period from July 1, 2017 through June 30, 2019
(“2017/2019 Treaty”). The following table describes the
quota share reinsurance ceding rates in effect for each treaty year
during Nine Months 2019 and Nine Months 2018 under the 2017/2019
Treaty, respectively. This table should be referred to in
conjunction with the discussions for net written premiums, net
premiums earned, ceding commission revenue and net loss and loss
adjustment expenses that follow.
|
|
Nine
months ended September 30, 2019
|
Nine
months ended September 30, 2018
|
||
|
|
January
1,
|
July
1,
|
January
1,
|
July
1,
|
|
|
to
|
to
|
to
|
to
|
|
|
June
30,
|
September
30,
|
June
30,
|
September
30,
|
|
|
("2018/2019 Treaty Year")
|
("2019/2020 Run-off Year")
|
("2017/2018 Treaty Year")
|
("2018/2019 Treaty Year")
|
|
|
|
|
|
|
|
Quota share reinsurance rates
|
|
|
|
|
|
Personal
lines
|
10% (1)
|
0% (2)
|
20% (1)
|
10% (1)
|
(1)
The
2017/2019 Treaty was a two-year treaty; quota share reinsurance
rate was reduced to 10% effective July 1, 2018 (the “2018
Cut-off”).
(2)
The
2017/2019 Treaty expired on a run-off basis effective July 1, 2019
(the “2019 Run-off”).
See
“Reinsurance” below for changes to our personal lines
quota share treaties effective July 1, 2019, 2018 and
2017.
Net
written premiums increased $19,653,000, or 22.4%, to $107,420,000
in Nine Months 2019 from $87,767,000 in Nine Months 2018. Net
written premiums include direct and assumed premiums, less the
amount of written premiums ceded under our reinsurance treaties
(quota share, excess of loss, and catastrophe). Our personal lines
business was subject to the 2017/2019 Treaty under the 2018/2019
Treaty Year through June 30, 2019. Following June 30, 2019, any
earned premium and associated claims for policies still inforce
will continue to be ceded under the 10% quota share rate until such
policies expire (run-off) over the next year. The 2019 Run-off
period is from July 1, 2019 through June 30, 2020 and there is no
return of unearned premiums under this arrangement. The 2018
Cut-off on July 1, 2018 resulted in a $4,553,000 return of unearned
premiums from our reinsurers that were previously ceded under the
expiring personal lines quota share treaty.
Excess of loss reinsurance treaties
An
increase in written premiums will increase the premiums ceded under
our excess of loss treaties. In Nine Months 2019, our ceded excess
of loss reinsurance premiums increased by $231,000 over the
comparable ceded premiums for Nine Months 2018. The increase was
due to an increase in premiums subject to excess of loss
reinsurance.
40
Catastrophe reinsurance treaties
Most
of the premiums written under our personal lines policies are also
subject to our catastrophe treaties. An increase in our personal
lines business gives rise to more property exposure, which
increases our exposure to catastrophe risk; therefore, our premiums
ceded under catastrophe treaties will increase. This results in an
increase in premiums ceded under our catastrophe treaties provided
that reinsurance rates are stable or are increasing. In Nine Months
2019, our premiums ceded under catastrophe treaties increased by
$3,301,000 over the comparable ceded premiums in Nine Months 2018.
The change was due to an increase in our catastrophe limit
purchased, an increase in premiums subject to catastrophe
reinsurance due to continued growth, and an increase in reinsurance
rates effective July 1, 2019. Our ceded catastrophe premiums are
paid based on the total direct written premiums subject to the
catastrophe reinsurance treaty.
Net premiums earned
Net
premiums earned increased $20,541,000, or 27.6%, to $95,017,000 in
Nine Months 2019 from $74,476,000 in Nine Months 2018. The increase
was due to the increase in written premiums discussed above and our
retaining more earned premiums effective: (1) July 1, 2019 as a
result of the expiration and non-renewal of the 2017/2019 Treaty,
and (2) July 1, 2018, as a result of the reduction in the quota
share reinsurance rates.
Ceding Commission Revenue
The
following table details the quota share provisional ceding
commission rates in effect during Nine Months 2019 and Nine Months
2018. This table should be referred to in conjunction with the
discussion for ceding commission revenue that follows.
|
|
Nine
months ended September 30, 2019
|
Nine
months ended September 30, 2018
|
||
|
|
January
1,
|
July
1,
|
January
1,
|
July
1,
|
|
|
to
|
to
|
to
|
to
|
|
|
June
30,
|
September
30,
|
June
30,
|
September
30,
|
|
|
("2018/2019 Treaty Year")
|
("2019/2020 Run-off Year")
|
("2017/2018 Treaty Year")
|
("2018/2019 Treaty Year")
|
|
|
|
|
|
|
|
Provisional ceding commission rate on quota share
treaty
|
|
|
||
|
Personal
lines
|
53%
|
0% (1)
|
53%
|
53%
|
(1)
The
2017/2019 Treaty expired on a run-off basis effective July 1, 2019,
allowing for provisional ceding commissions to be earned during the
2019/2020 Run-off Year.
The
following table summarizes the changes in the components of ceding
commission revenue (in thousands) for the periods
indicated:
|
|
Nine
months ended September 30,
|
|||
|
($ in thousands)
|
2019
|
2018
|
Change
|
Percent
|
|
|
|
|
|
|
|
Provisional
ceding commissions earned
|
$4,001
|
$5,468
|
$(1,467)
|
(26.8)%
|
|
|
|
|
|
|
|
Contingent
ceding commissions earned
|
|
|
|
|
|
Contingent
ceding commissions earned excluding
|
|
|
|
|
|
the
effect of catastrophes
|
(1,018)
|
(578)
|
(440)
|
76.1%
|
|
Effect
of catastrophes on ceding commissions earned
|
-
|
(459)
|
459
|
n/a
|
|
Contingent
ceding commissions earned
|
(1,018)
|
(1,037)
|
19
|
(1.8)%
|
|
|
|
|
|
|
|
Total
ceding commission revenue
|
$2,983
|
$4,431
|
$(1,448)
|
(32.7)%
|
41
Ceding
commission revenue was $2,983,000 in Nine Months 2019 compared to
$4,431,000 in Nine Months 2018. The decrease of $1,448,000, or
32.7%, was due to a decrease in provisional ceding commissions
earned, partially offset by an increase in contingent ceding
commissions earned. The reduction in provisional ceding commissions
occurred due to the reduction in quota share reinsurance rates (see
below for discussion of provisional ceding commissions earned and
contingent ceding commissions earned).
Provisional Ceding Commissions Earned
We
receive a provisional ceding commission based on ceded written
premiums. The $1,467,000 decrease in provisional ceding commissions
earned is primarily due to: (1) the decrease in the quota share
ceding rate effective July 1, 2018 to 10%, from the 20% rate in
effect from July 1, 2017 through June 30, 2018, and (2) the
elimination of the 10% quota share effective July 1, 2019. There
was a reduction in ceded premiums in Nine Months 2019 available
from which to earn ceding commissions compared to Nine Months 2018.
The decrease was partially offset by an increase in personal lines
direct written premiums subject to the quota share.
Contingent Ceding Commissions Earned
We
receive a contingent ceding commission based on a sliding scale in
relation to the losses incurred under our quota share treaties. The
lower the ceded loss ratio, the more contingent commission we
receive. The amount of contingent ceding commissions we are
eligible to receive under the 2017/2019 Treaty is subject to change
based on losses incurred from claims with accident dates beginning
July 1, 2017. The amount of contingent ceding commissions we are
eligible to receive under our prior years’ quota share
treaties is subject to change based on losses incurred related to
claims with accident dates before July 1, 2017.
The
2017/2019 Treaty structure limits the amount of contingent ceding
commissions that we can receive by setting a higher provisional
commission rate than the rates received in prior years. As a result
of the higher upfront provisional ceding commissions that we
received under the 2017/2019 Treaty, there is not an opportunity to
earn additional contingent ceding commissions under this treaty.
Under the 2017/2019 Treaty “net” treaty structure,
catastrophe losses in excess of the $5,000,000 retention will fall
outside of the quota share treaty and such losses will not have an
impact on contingent ceding commissions. In Nine Months 2018,
catastrophe losses of $1,497,000 were ceded under our personal
lines quota share treaty. These catastrophe losses resulted in the
Loss Ratios for the period July 1, 2017 through June 30, 2018
(attributable to the 2017/2019 Treaty) being higher than the
contractual Loss Ratio at which provisional ceding commissions were
being earned. As a result, we incurred a reduction to the
contingent ceding commissions of $459,000 relative to what would
have been earned had the catastrophe losses not occurred. Effective
July 1, 2018, the provisional ceding commission rate was a fixed
rate with no downward adjustment required related to Loss Ratio;
accordingly, in Nine Months 2019, catastrophe losses of $808,000
that were ceded under our personal lines quota share treaty did not
have an effect on contingent ceding commissions. See
“Reinsurance” below for information as to our personal
lines quota share treaty effective July 1, 2019, 2018 and
2017.
Net Investment Income
Net
investment income was $5,200,000 in Nine Months 2019 compared to
$4,543,000 in Nine Months 2018. The increase of $657,000, or 14.5%,
was due to an increase in average invested assets in Nine Months
2019. The average yield on invested assets was 3.62% as of
September 30, 2019 compared to 3.37% as of September 30, 2018. The
pre-tax equivalent yield on invested assets was 3.45% and 3.44% as
of September 30, 2019 and 2018, respectively.
Cash
and invested assets were $221,610,000 as of September 30, 2019
compared to $196,595,000 as of September 30, 2018. The $25,015,000
increase in cash and invested assets resulted primarily from
increased operating cash flows for the period after September 30,
2018.
Net Gains and Losses on Investments
Net
gains on investments were $3,712,000 in Nine Months 2019 compared
to a net loss of $278,000 in Nine Months 2018. Unrealized gains on
our equity securities and other investments in Nine Months 2019
were $3,767,000, compared to an unrealized gain of $99,000 in Nine
Months 2018. Realized losses on sales of investments were $55,000
and $377,000 in Nine Months 2019 and Nine Months 2018,
respectively.
42
Other Income
Other
income was $1,192,000 in Nine Months 2019 compared to $962,000 in
Nine Months 2018. The increase of $230,000, or 23.9%, was primarily
due to commission revenue from Cosi and an increase in installment
and other fees earned in our insurance underwriting business in
Nine Months 2019.
Net Loss and LAE
Net loss and LAE was $71,588,000
in Nine Months 2019 compared to
$41,739,000 in Nine Months 2018. The
net loss ratio was 75.3% in Nine Months 2019 compared to 56.0% in
Nine Months 2018, an increase of 19.3 percentage
points.
The following graph summarizes
the changes in the components of net loss ratio for the periods
indicated, along with the comparable components excluding
commercial lines business:
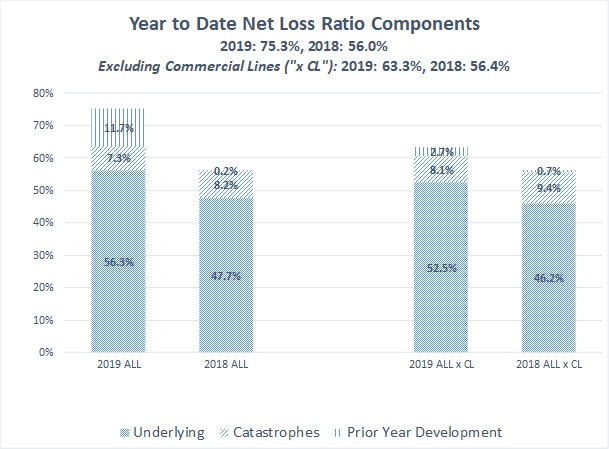
(Percent components may not sum to totals due to
rounding)
During
Nine Months 2019, the loss ratio was 75.3%, a 19.3 point increase
compared to Nine Months 2018. The loss ratio for Nine Months 2019
is elevated primarily due to prior year loss development of $11.1
million, which has an 11.7 point effect on the loss ratio. This
compares to 0.2 points of prior year loss development in Nine
Months 2018, or an increase of 11.5 points from the impact of prior
year loss development. Unfavorable claim resolution trends led to a
complete review of open liability case reserves. The review
determined that case reserve strengthening was required, of which,
$8.8 million of these case reserve adjustments were from commercial
lines liability claims. These case reserve adjustments demonstrated
the high volatility of our commercial lines business and
contributed to our decision to no longer underwrite these risks.
This prior year loss development significantly increased the
ultimate loss ratio projections for the commercial lines business
in accident years 2014 and forward. Excluding commercial lines,
prior year development for Nine Months 2019 had a 2.7 point impact
on our loss ratio, compared to a 0.7 point impact of prior year
loss development for Nine Months 2018.
43
The
impact of catastrophes, although lower than through Nine Months
2018, is significant and above average in both nine month periods.
Through Nine Months 2019, catastrophe losses have a 7.3 point
impact on the loss ratio, compared to an 8.2 point impact for Nine
Months 2018, or a reduction in the impact of catastrophes of 0.9
points. The average catastrophe impact for the five years ending
2018 has been 3.8 points, so both Nine Months 2018 and Nine Months
2019 have a significantly higher catastrophe impact than normal.
Although there have been seven PCS catastrophe events affecting
Kingstone in Nine Months 2019, 64% of net losses or 4.6 points of
the impact relates to the first winter freeze event in
Mid-January.
The
underlying loss ratio excluding the impact of catastrophes and
prior year loss development was 56.3% for Nine Months 2019, an
increase of 8.6 points from the 47.7% underlying loss ratio
recorded for Nine Months 2018. The underlying loss ratio
increased compared to Nine Months 2018 due to continued increases
in average claim severity for non-weather water damage property
claims as well as increased large fire claim activity. In addition,
the underlying loss ratio for Nine Months 2019 is affected by
increased loss ratio expectations for commercial lines as a result
of increases in prior year loss ratio estimates for that business
as noted above. Excluding commercial lines, the underlying loss
ratio excluding the impact of catastrophes and prior year
development for Nine Months 2019 was 52.5%, an increase of 6.34
points from the 46.1% underlying loss ratio recorded for Nine
Months 2018. See table below under “Additional Financial
Information” summarizing net loss ratios by line of
business.
Commission Expense
Commission
expense was $21,932,000 in Nine Months 2019 or 18.7% of direct
earned premiums. Commission expense was $18,411,000 in Nine Months
2018 or 18.9% of direct earned premiums. The increase of $3,521,000
is primarily due to the increase in direct earned premiums for Nine
Months 2019 as compared to Nine Months 2018.
Other Underwriting Expenses
Other
underwriting expenses were $17,983,000 in Nine Months 2019 compared
to $15,301,000 in Nine Months 2018. The increase of $2,682,000, or
17.5%, was primarily due to expenses related to growth in direct
written premiums. Expenses directly related to the increase in
direct written premiums primarily consist of underwriting expenses,
software usage fees, and state premium taxes. Expenses indirectly
related to the increase in direct written premiums primarily
consist of salaries along with related other employment costs. The
other underwriting expense increase of 17.5 points was less than
the 19.7 point increase in total direct written
premiums.
Our
largest single component of other underwriting expenses is salaries
and employment costs, with costs of $7,637,000 in Nine Months 2019
compared to $6,862,000 in Nine Months 2018. The increase of
$775,000, or 11.3%, was less than the 19.7% increase in total
direct written premiums. The increase in employment costs was due
to hiring of additional staff to service our current level of
business and anticipated growth in volume, as well as annual
increases in salaries.
Our
net underwriting expense ratio in Nine Months 2019 was 37.8%
compared to 38.1% in Nine Months 2018. The following table shows
the individual components of our net underwriting expense ratio for
the periods indicated:
|
|
Nine
months ended
|
||
|
|
September
30,
|
Percentage
|
|
|
|
2019
|
2018
|
Point
Change
|
|
|
|
|
|
|
Other
underwriting expenses
|
|
|
|
|
Employment
costs
|
8.0%
|
9.2%
|
(1.2)
|
|
Underwriting
fees (inspections/data services)
|
2.4
|
2.4
|
-
|
|
Other
expenses
|
8.4
|
9.0
|
(0.6)
|
|
Total
other underwriting expenses
|
18.8
|
20.6
|
(1.8)
|
|
|
|
|
|
|
Ceding
commission revenue
|
|
|
|
|
Provisional
|
(4.2)
|
(7.3)
|
3.1
|
|
Contingent
|
1.1
|
1.4
|
(0.3)
|
|
Total
ceding commission revenue
|
(3.1)
|
(5.9)
|
2.8
|
|
|
|
|
|
|
Other
income
|
(1.0)
|
(1.3)
|
0.3
|
|
Commission
expense
|
23.1
|
24.7
|
(1.6)
|
|
|
|
|
|
|
Net
underwriting expense ratio
|
37.8%
|
38.1%
|
(0.3)
|
44
The
1.8 percentage point decrease in our other underwriting expense
ratio was driven by a decline of 1.2 percentage points from the
impact of employment costs.
The
overall 3.1 percentage point increase in provisional ceding
commissions was driven entirely by the change in our quota share
ceding rates and its impact on provisional ceding commission
revenue due to the additional retention resulting from the cut-off
to our quota share treaty on July 1, 2018 and run-off to our
expired quota share treaty on July 1, 2019. The components of our
net underwriting expense ratio related to other underwriting
expenses, other income and commissions improved in nearly all
categories, resulting in an overall 0.3 percentage point decrease
in the net underwriting expense ratio.
Other Operating Expenses
Other
operating expenses, related to the expenses of our holding company
and Cosi, were $2,774,000 for Nine Months 2019 compared to
$1,774,000 for Nine Months 2018. The increase in Nine Months 2019
of $1,000,000, or 56.4%, as compared to Nine Months 2018 was
primarily due to increases in equity compensation and salaries,
partially offset by a decrease in executive bonuses. The increase
in salary was due to the initial hiring of staff for Cosi and the
increase in equity compensation was due to 2019 annual restricted
stock awards to directors and executives. Executive bonus
compensation is accrued pursuant to the employment agreement
effective January 1, 2017 with Barry B. Goldstein, our Executive
Chairman and current Chief Executive Officer. The bonus is a
one-time payment computed at the end of the three-year period ended
December 31, 2019, and as of September 30, 2019 the three-year
computation did not meet the required terms of profitability,
resulting in the reversal of $698,000 previously
accrued.
Depreciation and Amortization
Depreciation
and amortization was $1,876,000 in Nine Months 2019 compared to
$1,274,000 in Nine Months 2018. The increase of $602,000, or 47.3%,
in depreciation and amortization was primarily due to depreciation
of our new system platform for processing business being written in
Expansion states and newly purchased assets used to upgrade our
systems infrastructure and improvements to the Kingston, New York
home office building from which we operate.
Interest Expense
Interest
expense for Nine Months 2019 was $1,370,000 compared to $1,365,000
in Nine Months 2018. We incurred interest expense in
connection with our $30.0 million issuance of long-term debt in
December 2017.
Income Tax Benefit/Expense
Income
tax benefit in Nine Months 2019 was $1,998,000, which resulted in
an effective tax rate of 21.2%. Income tax expense in Nine Months
2018 was $296,000, which resulted in an effective tax rate of 6.9%.
Loss before taxes was $9,419,000 in Nine Months 2019 compared to
income before taxes of $4,269,000 in Nine Months 2018.
45
Net Loss/Income
Net
loss was $7,421,000 in Nine Months 2019 compared to net income of
$3,973,000 in Nine Months 2018. The decrease in net income of
$11,394,000 was due to the circumstances described above, which
caused the increase in our net loss ratio, decrease in ceding
commission revenue, increases in other underwriting and operating
expenses, and depreciation and amortization, partially offset by
the increase in our net premiums earned, net investment income, and
net gains on investments.
Three Months Ended September 30, 2019 Compared to Three Months
Ended September 30, 2018
The
following table summarizes the changes in the results of our
operations (in thousands) for the periods indicated:
|
|
Three
months ended September 30,
|
|||
|
($ in thousands)
|
2019
|
2018
|
Change
|
Percent
|
|
Revenues
|
|
|
|
|
|
Direct
written premiums
|
$46,023
|
$38,785
|
$7,238
|
18.7%
|
|
Assumed
written premiums
|
1
|
-
|
1
|
na
% |
|
|
46,024
|
38,785
|
7,239
|
18.7%
|
|
Ceded
written premiums
|
|
|
|
|
|
Ceded
to quota share treaties (1)
|
147
|
(1,473)
|
1,620
|
(110.0)%
|
|
Ceded
to excess of loss treaties
|
386
|
392
|
(6)
|
(1.5)%
|
|
Ceded
to catastrophe treaties
|
5,053
|
3,764
|
1,289
|
34.2%
|
|
Total
ceded written premiums
|
5,586
|
2,683
|
2,903
|
108.2%
|
|
|
|
|
|
|
|
Net
written premiums
|
40,438
|
36,102
|
4,336
|
12.0%
|
|
|
|
|
|
|
|
Change
in unearned premiums
|
|
|
|
|
|
Direct
and assumed
|
(4,581)
|
(4,435)
|
(146)
|
3.3%
|
|
Ceded
to quota share treaties
|
(1,637)
|
(4,133)
|
2,496
|
(60.4)%
|
|
Change
in net unearned premiums
|
(6,218)
|
(8,568)
|
2,350
|
(27.4)%
|
|
|
|
|
|
|
|
Premiums
earned
|
|
|
|
|
|
Direct
and assumed
|
41,443
|
34,351
|
7,092
|
20.6%
|
|
Ceded
to reinsurance treaties
|
(7,223)
|
(6,817)
|
(406)
|
6.0%
|
|
Net
premiums earned
|
34,220
|
27,534
|
6,686
|
24.3%
|
|
|
|
|
|
|
|
Ceding
commission revenue
|
1,030
|
1,045
|
(15)
|
(1.4)%
|
|
Net
investment income
|
1,856
|
1,602
|
254
|
15.9%
|
|
Net
gains on investments
|
998
|
352
|
646
|
183.5%
|
|
Other
income
|
496
|
353
|
143
|
40.5%
|
|
Total
revenues
|
38,600
|
30,886
|
7,714
|
25.0%
|
|
Expenses
|
|
|
|
|
|
Loss
and loss adjustment expenses
|
|
|
|
|
|
Direct
and assumed:
|
|
|
|
|
|
Loss
and loss adjustment expenses excluding the effect of
catastrophes
|
26,518
|
16,705
|
9,813
|
58.7%
|
|
Losses
from catastrophes (2)
|
491
|
244
|
247
|
101.2%
|
|
Total
direct and assumed loss and loss adjustment expenses
|
27,009
|
16,949
|
10,060
|
59.4%
|
|
|
|
|
|
|
|
Ceded
loss and loss adjustment expenses:
|
|
|
|
|
|
Loss
and loss adjustment expenses excluding the effect of
catastrophes
|
2,182
|
3,798
|
(1,616)
|
(42.5)%
|
|
Losses
from catastrophes (2)
|
45
|
(146)
|
191
|
(130.8)%
|
|
Total
ceded loss and loss adjustment expenses
|
2,227
|
3,652
|
(1,425)
|
(39.0)%
|
|
|
|
|
|
|
|
Net
loss and loss adjustment expenses:
|
|
|
|
|
|
Loss
and loss adjustment expenses excluding the effect of
catastrophes
|
24,335
|
12,907
|
11,428
|
88.5%
|
|
Losses
from catastrophes (2)
|
446
|
390
|
56
|
14.4%
|
|
Net
loss and loss adjustment expenses
|
24,781
|
13,297
|
11,484
|
86.4%
|
|
|
|
|
|
|
|
Commission
expense
|
7,779
|
6,594
|
1,185
|
18.0%
|
|
Other
underwriting expenses
|
6,431
|
5,194
|
1,237
|
23.8%
|
|
Other
operating expenses
|
705
|
683
|
22
|
3.2%
|
|
Depreciation
and amortization
|
646
|
440
|
206
|
46.8%
|
|
Interest
expense
|
457
|
457
|
-
|
-%
|
|
Total
expenses
|
40,799
|
26,665
|
14,135
|
53.0%
|
|
|
|
|
|
|
|
(Loss)
income before taxes
|
(2,199)
|
4,221
|
(6,420)
|
(152.1)%
|
|
Income
tax (benefit) expense
|
(474)
|
287
|
(761)
|
(265.2)%
|
|
Net (loss) income
|
$(1,725)
|
$3,934
|
$(5,659)
|
(143.8)%
|
(1)
Effective July 1, 2018, we decreased the quota share ceding rate in
our personal lines quota share treaty from 20% to 10%. Effective
July 1, 2019, our personal lines 10% quota share treaty expired on
a run-off basis.
(2) The
three months ended September 30, 2019 includes catastrophe losses,
which are defined as losses from an event for which a catastrophe
bulletin and related serial number has been issued by the Property
Claims Services (PCS) unit of the Insurance Services Office (ISO).
PCS catastrophe bulletins are issued for events that cause more
than $25 million in total insured losses and affect a significant
number of policyholders and insurers.
46
|
|
Three
months ended September 30,
|
|||
|
|
2019
|
2018
|
Percentage
Point Change
|
Percent
Change
|
|
Key ratios:
|
|
|
|
|
|
Net
loss ratio
|
72.4%
|
48.3%
|
24.1
|
49.9%
|
|
Net
underwriting expense ratio
|
37.5%
|
37.7%
|
(0.2)
|
(0.5)%
|
|
Net
combined ratio
|
109.9%
|
86.0%
|
23.9
|
27.8%
|
Direct Written Premiums
Direct written premiums during the three months
ended September 30, 2019 (“Three Months 2019”)
were $46,023,000 compared
to $38,785,000 during the three
months ended September 30, 2018 (“Three Months 2018”).
The increase of $7,238,000, or
18.7%, was primarily due to an increase in policies in-force during
Three Months 2019 as compared to Three Months 2018 driven by
continued growth in new business. We wrote more new policies as a
result of continued demand for our products in the markets that we
serve. Policies in-force increased by 17.7% as of September 30,
2019 compared to September 30, 2018.
In
2017, we started writing homeowners’ policies in New Jersey
and Rhode Island. We began writing homeowners policies in
Massachusetts in 2018 and Connecticut in March of 2019. We refer to
our New York business as our “Core” business and the
business outside of New York as our “Expansion”
business. Direct written premiums from our Expansion business were
$7,371,000 in Three Months 2019, compared to $2,855,000 in Three
Months 2018.
Net Written Premiums and Net Premiums Earned
Our
personal lines quota share reinsurance treaties in effect for Three
Months 2019 and Three Months 2018 were covered under a treaty
covering a two-year period from July 1, 2017 through June 30, 2019
(“2017/2019 Treaty”). The following table describes the
quota share reinsurance ceding rates in effect for each treaty year
during Three Months 2019 and Three Months 2018 under the 2017/2019
Treaty, respectively. This table should be referred to in
conjunction with the discussions for net written premiums, net
premiums earned, ceding commission revenue and net loss and loss
adjustment expenses that follow.
|
|
Three
months ended September 30,
|
|
|
|
2019
|
2018
|
|
|
("2019/2020
Run-off Year")
|
("2018/2019
Treaty Year")
|
|
|
|
|
|
Quota share reinsurance rates
|
|
|
|
Personal
lines
|
0% (2)
|
10% (1)
|
(1)
The
2017/2019 Treaty was a two-year treaty; quota share reinsurance
rate was reduced to 10% effective July 1, 2018 (the “2018
Cut-off”).
(2)
The
2017/2019 Treaty expired on a run-off basis effective July 1, 2019
(the “2019 Run-off”).
See
“Reinsurance” below for changes to our personal lines
quota share treaties effective July 1, 2019, 2018 and
2017.
47
Net written premiums increased
$4,336,000, or 12.0%, to
$40,438,000 in Three Months 2019
from $36,102,000 in Three
Months 2018. Net written premiums include direct and assumed
premiums, less the amount of written premiums ceded under our
reinsurance treaties (quota share, excess of loss, and
catastrophe). Our personal lines business was subject to the
2017/2019 Treaty under the 2018/2019 Treaty Year through June 30,
2019. Following June 30, 2019, any earned premium and associated
claims for policies still inforce will continue to be ceded under
the 10% quota share rate until such policies expire (run-off) over
the next year. The 2019 Run-off period is from July 1, 2019 through
June 30, 2020 and there is no return of unearned premiums under
this arrangement. The 2018 Cut-off on July 1, 2018 resulted in a
$4,553,000 return of unearned premiums from our reinsurers that
were previously ceded under the expiring personal lines quota share
treaty.
Excess of loss reinsurance treaties
An
increase in written premiums will, to a lesser extent, increase the
premiums ceded under our excess of loss treaties. In Three Months
2019, our ceded excess of loss reinsurance premiums increased by
$122,000 over the comparable ceded premiums for Three Months 2018.
The increase is due to an increase in premiums subject to excess of
loss reinsurance.
Catastrophe reinsurance treaties
Most
of the premiums written under our personal lines policies are also
subject to our catastrophe treaty. An increase in our personal
lines business gives rise to more property exposure, which
increases our exposure to catastrophe risk; therefore, our premiums
ceded under catastrophe treaties will increase. This results in an
increase in premiums ceded under our catastrophe treaty provided
that reinsurance rates are stable or are increasing. In Three
Months 2019, our premiums ceded under catastrophe treaties
increased by $1,289,000 over the comparable ceded premiums for
Three Months 2018. The change was due to an increase in our
catastrophe limit purchases, an increase in premiums subject to
catastrophe reinsurance due to continued growth, and an increase in
reinsurance rates. Our ceded catastrophe premiums are paid based on
the total direct written premiums subject to the catastrophe
reinsurance treaty.
Net premiums earned
Net
premiums earned increased $6,686,000, or 24.3 %, to $34,220,000 in
Three Months 2019 from $27,534,000 in Three Months 2018. The
increase was due to the increase in written premiums discussed
above and our retaining more earned premiums effective: (1) July 1,
2019 as a result of the expiration and non-renewal of the 2017/2019
Treaty, and (2) July 1, 2018, as a result of the reduction in the
quota share reinsurance rates.
Ceding Commission Revenue
The
following table details the quota share provisional ceding
commission rates in effect during Three Months 2019 and Three
Months 2018. This table should be referred to in conjunction with
the discussion for ceding commission revenue that
follows.
|
|
Three
months ended
|
|
|
|
September
30,
|
|
|
|
2019
|
2018
|
|
|
("2019/2020
Run-off Year")
|
("2018/2019
Treaty Year ")
|
|
|
|
|
| Provisional ceding commission rate on quota share treaty |
|
|
|
Personal
lines
|
0% (1)
|
53%
|
(1)
The
2017/2019 Treaty expired on a run-off basis effective July 1, 2019,
allowing for provisional ceding commissions to be earned during the
2019/2020 Run-off Year.
48
The
following table summarizes the changes in the components of ceding
commission revenue (in thousands) for the periods
indicated:
|
|
Three
months ended September 30,
|
|||
|
($ in thousands)
|
2019
|
2018
|
Change
|
Percent
|
|
|
|
|
|
|
|
Provisional
ceding commissions earned
|
$1,320
|
$1,255
|
$65
|
5.2%
|
|
Contingent
ceding commissions earned
|
(290)
|
(210)
|
(80)
|
38.1%
|
|
|
|
|
|
|
|
Total
ceding commission revenue
|
$1,030
|
$1,045
|
$(15)
|
(1.4)%
|
Ceding commission revenue was $1,030,000
in Three Months 2019 compared
to $1,045,000 in Three Months
2018. The decrease of $15,000, or 1.4%, was due to an increase in provisional
ceding commissions earned, partially offset by a decrease in
contingent ceding commissions earned. See below for discussion of
provisional ceding commissions earned and contingent ceding
commissions earned.
Provisional Ceding Commissions
Earned
We
receive a provisional ceding commission based on ceded written
premiums. The $65,000 increase in provisional ceding commissions
earned is primarily due the increase in personal lines direct
written premiums subject to the quota share before the effective
date of the 2019 Run-off and the continuation of ceded earned
premiums in the 2019/2020 Run-off Year.
Contingent Ceding Commissions Earned
We
receive a contingent ceding commission based on a sliding scale in
relation to the losses incurred under our quota share treaties. The
lower the ceded loss ratio, the more contingent commission we
receive. The amount of contingent ceding commissions we are
eligible to receive under the 2017/2019 Treaty is subject to change
based on losses incurred from claims with accident dates beginning
July 1, 2017. The amount of contingent ceding commissions we are
eligible to receive under our prior years’ quota share
treaties is subject to change based on losses incurred related to
claims with accident dates before July 1, 2017.
The
2017/2019 Treaty structure limits the amount of contingent ceding
commissions that we can receive by setting a higher provisional
commission rate than the rates received in prior years. As a result
of the higher upfront provisional ceding commissions that we
received under the 2017/2019 Treaty, there is not an opportunity to
earn additional contingent ceding commissions under this treaty.
Under the 2017/2019 Treaty “net” treaty structure,
catastrophe losses in excess of the $5,000,000 retention will fall
outside of the quota share treaty and such losses will not have an
impact on contingent ceding commissions. In Three Months 2018,
catastrophe losses of $1,497,000 were ceded under our personal
lines quota share treaty. These catastrophe losses resulted in the
Loss Ratios for the period July 1, 2017 through June 30, 2018
(attributable to the 2017/2019 Treaty) being higher than the
contractual Loss Ratio at which provisional ceding commissions were
being earned. Effective July 1, 2018, the provisional ceding
commission rate was a fixed rate with no downward adjustment
required related to Loss Ratio; accordingly, in Three Months 2019,
catastrophe losses of $808,000 that were ceded under our personal
lines quota share treaty did not have an effect on contingent
ceding commissions. See “Reinsurance” below for
information as to our personal lines quota share treaty effective
July 1, 2019, 2018 and 2017.
49
Net Investment Income
Net investment income was $1,856,000
in Three Months 2019 compared
to $1,602,000 in Three Months
2018. The increase of $254,000,
or 15.9%, was due to an increase in average invested assets in
Three Months 2019. The average yield on invested assets was 3.62%
as of September 30, 2019 compared to 3.72% as of September 30,
2018. The pre-tax equivalent yield on invested assets was 3.37% and
3.44% as of September 30, 2019 and 2018,
respectively.
Cash
and invested assets were $221,610,000 as of September 30, 2019,
compared to $196,595,000 as of September 30, 2018. The $25,015,000
increase in cash and invested assets resulted primarily from
increased operating cash flows for the period after September 30,
2018.
Net Gains and Losses on Investments
Net
gains on investments were $998,000 and $352,000 in Three Months
2019 and Three Months 2018, respectively. Unrealized gains on our
equity securities and other investments were $1,007,000 and
$409,000 in Three Months 2019 and Three Months 2018, respectively.
Realized losses on sales of investments were $8,000 and $57,000 in
Three Months 2019 and Three Months 2018, respectively.
Other Income
Other
income was $496,000 in Three Months 2019 compared to $353,000 in
Three Months 2018. The increase of $143,000, or 40.5%, was
primarily due to commission revenue from Cosi and an increase in
installment and other fees earned in our insurance underwriting
business in Three Months 2019.
Net Loss and LAE
Net
loss and LAE was $24,781,000 in Three Months 2019 compared to
$13,297,000 in Three Months 2018. The net loss ratio was 72.4% in
Three Months 2019 compared to 48.3% in Three Months 2018, an
increase of 24.1 percentage points.
The following graph summarizes
the changes in the components of net loss ratio for the periods
indicated, along with the comparable components excluding
commercial lines business:
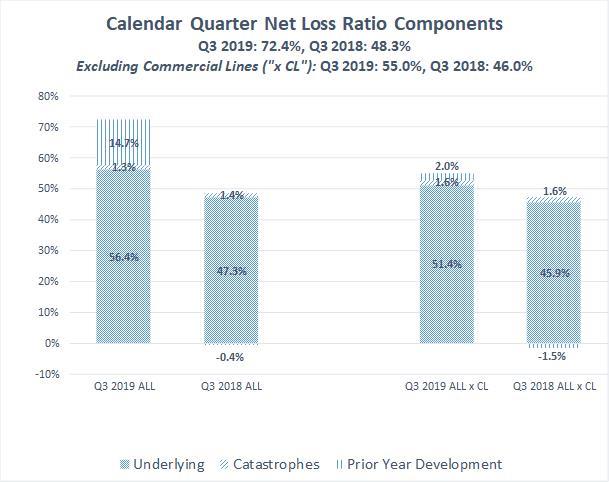
(Percent components may not sum to totals due to
rounding)
50
During
Three Months 2019, the net loss ratio increased by 24.1 points
compared to Three Months 2018 for several reasons. First, a
continued evaluation of case reserve levels resulted in an
additional $5.0 million of prior year development for the quarter,
impacting the quarterly loss ratio by 14.7 points. This compares to
0.4 points of favorable prior year loss development in Three Months
2018, or an increase in the impact of prior year loss development
of 15.1 points. Prior year loss development for the quarter was
primarily related to older liability claims, of which, $4.4 million
were related to commercial lines liability claims. During the
quarter, an external actuarial review was completed that was
specific to those lines affected by liability case reserve
adjustments made earlier in the year. The external review analyzed
the adequacy of a sampling of individual case reserves after the
case reserve adjustments. Following this external review, it was
determined that additional adjustments to IBNR and expected
ultimate losses for prior years were needed. This resulted in the
additional prior year loss development recorded during the Three
Months 2019. Excluding commercial lines, the impact of prior year
development in Three Months 2019 was 2.0 points, compared to 1.5
points of favorable prior year development in Three Months 2018, or
an increase in the impact of prior year development of 3.5 points.
The impact from catastrophe losses during the Three Months 2019 was
1.3 points, compared to a 1.4 point impact from catastrophes for
the Three Months 2018, or a reduction in the impact of catastrophes
of 0.1 point.
The
underlying loss ratio excluding the impact of catastrophes and
prior year development was 56.4% in Three Months 2019, compared to
47.3% in Three Months 2018, an increase of 9.1 points. The
underlying loss ratio increased for three reasons. First, continued
higher claim severity was observed for personal lines related to
non-weather related water claims. Second, fire claim activity was
unusually high for Three Months 2019 in personal lines. Third, the
external actuarial review of reserve levels resulted in a higher
commercial lines loss ratio expectation for the current accident
year than was recorded for Three Months 2018. Excluding commercial
lines, the underlying loss ratio excluding the impact of
catastrophes and prior year development was 51.4% in Three Months
2019, compared to 45.9% in Three Months 2018, or an increase of 5.5
points. See table below under “Additional Financial
Information” summarizing net loss ratios by line of
business.
Commission Expense
Commission expense was $7,779,000 in Three
Months 2019 or 18.8% of direct
earned premiums. Commission expense was $6,594,000 in Three Months
2018 or 19.2% of direct earned premiums. The increase of $1,185,000
is due to the increase in direct earned premiums in Three
Months 2019 as compared to
Three Months 2018. The decrease in
commission rate was due to the decrease in commercial lines
premiums related to our decision to stop writing theses lines
beginning in July 2019. Commercial lines has a lower average
commission rate than our other continuing lines of
business.
51
Other Underwriting Expenses
Other
underwriting expenses were $6,431,000 in Three Months 2019 compared
to $5,194,000 in Three Months 2018. The increase of $1,237,000, or
23.8%, was primarily due to expenses related to growth in direct
written premiums. Expenses directly related to the increase in
direct written premiums primarily consist of underwriting expenses,
software usage fees, and state premium taxes. Expenses indirectly
related to the increase in direct written premiums primarily
consist of salaries along with related other employment costs. The
23.8% increase in other underwriting expenses was greater than the
18.7% increase in total direct written premiums. The greater
increase in other underwriting expenses compared to direct written
premium growth is primarily due to the decline in commercial lines
premiums written.
The
largest single component of other underwriting expenses is salaries
and employment costs, with costs of $2,737,000 in Three Months 2019
compared to $2,339,000 in Three Months 2018. The increase of
$398,000, or 17.0%, was less than the 18.7% increase in total
direct written premiums. The increase in employment costs was due
to hiring of additional staff to service our current level of
business and anticipated growth in volume, as well as annual
increases in salaries.
Our
net underwriting expense ratio in Three Months 2019 was 37.5%
compared to 37.7% in Three Months 2018. The following table shows
the individual components of our net underwriting expense ratio for
the periods indicated:
|
|
Three
months ended September 30,
|
|
|
|
|
2019
|
2018
|
Percentage Point
Change
|
|
Other
underwriting expenses
|
|
|
|
|
Employment costs
|
8.0%
|
8.5%
|
(0.5)
|
|
Underwriting fees (inspections/data
services)
|
2.3
|
2.4
|
(0.1)
|
|
Other expenses
|
8.6
|
7.9
|
0.7
|
|
Total other underwriting
expenses
|
18.9
|
18.8
|
0.1
|
|
|
|
|
|
|
Ceding commission
revenue
|
|
|
|
|
Provisional
|
(3.9)
|
(4.6)
|
0.7
|
|
Contingent
|
0.8
|
0.8
|
-
|
|
Total ceding commission
revene
|
(3.1)
|
(3.8)
|
0.7
|
|
|
|
|
|
|
Other income
|
(1.0)
|
(1.2)
|
0.3
|
|
Commission expense
|
22.7
|
23.9
|
(1.2)
|
|
|
|
|
|
|
Net underwriting expense
ratio
|
37.5%
|
37.7%
|
(0.2)
|
52
The
overall 0.7 percentage point increase in provisional ceding
commissions was driven entirely by the change in our quota share
ceding rates and its impact on provisional ceding commission
revenue due to the additional retention resulting from the cut-off
to our quota share treaty on July 1, 2018 and run-off to our
expired quota share treaty on July 1, 2019. The components of our
net underwriting expense ratio related to other underwriting
expenses, other income and commissions improved in nearly all
categories, resulting in an overall 0.2 percentage point decrease
in the net underwriting expense ratio.
Other Operating Expenses
Other
operating expenses, related to the expenses of our holding company
and Cosi, were $705,000 for Three Months 2019 compared to $683,000
for Three Months 2018. The increase in Three Months 2019 of
$22,000, or 3.2%, compared to Three Months 2018, was primarily due
to increases in equity compensation, salaries, professional fees
and Cosi commission expense, partially offset by a decrease in
executive bonuses. The increase in salary was due to the initial
hiring of staff for Cosi and the increase in equity compensation
was due to 2019 annual restricted stock awards to directors and
executives. Executive bonus compensation is accrued pursuant to the
employment agreement effective January 1, 2017 with Barry B.
Goldstein, our Executive Chairman and current Chief Executive
Officer. The bonus is a one-time payment computed at the end of the
three-year period ended December 31, 2019, and as of September 30,
2019 the three-year computation did not meet the required terms of
profitability, resulting in the reversal of $698,000 previously
accrued.
Depreciation and Amortization
Depreciation
and amortization was $646,000 in Three Months 2019 compared to
$440,000 in Three Months 2018. The increase of $206,000, or 46.8%,
in depreciation and amortization was primarily due to depreciation
of our new system platform for processing business being written in
Expansion states. The increase was also impacted by newly purchased
assets used to upgrade our systems infrastructure and improvements
to the Kingston, New York home office building from which we
operate.
Interest Expense
Interest
expense in Three Months 2019 and Three Months 2018 was $457,000. We
incurred interest expense in connection with our $30.0 million
issuance of long-term debt in December 2017.
Income Tax Benefit/Expense
Income
tax benefit in Three Months 2019 was $474,000, which resulted in an
effective tax rate of 21.6%. Income tax expense in Three Months
2018 was $287,000, which resulted in an effective tax rate of 6.8%.
Loss before taxes was $2,199,000 in Three Months 2019 compared to
income before taxes of $4,221,000 in Three Months
2018.
Net Loss/Income
Net
loss was $1,725,000 in Three Months 2019 compared to net income of
$3,934,000 in Three Months 2018. The decrease in net income of
$5,659,000, or 143.8%, was due to the circumstances described
above, which caused the increase in our net loss ratio, decrease in
ceding commission revenue, increases in other underwriting
expenses, depreciation and amortization and interest expense,
partially offset by the increase in our net premiums earned, net
investment income and gains on investments.
53
Additional Financial Information
We
operate our business as one segment, property and casualty
insurance. Within this segment, we offer an array of property and
casualty policies to our producers. The following table summarizes
gross and net written premiums, net premiums earned, and net loss
and loss adjustment expenses by major product type, which were
determined based primarily on similar economic characteristics and
risks of loss.
|
|
For
the Three Months Ended
|
For
the Nine Months Ended
|
||
|
|
September
30,
|
September
30,
|
||
|
|
2019
|
2018
|
2019
|
2018
|
|
Gross premiums written:
|
|
|
|
|
|
Personal
lines
|
$40,996,459
|
$32,544,609
|
$109,143,415
|
$87,022,189
|
|
Livery
physical damage
|
2,590,434
|
2,363,844
|
8,199,269
|
7,142,413
|
|
Other(1)
|
401,073
|
69,486
|
535,950
|
186,285
|
|
Total
without commercial lines
|
43,987,966
|
34,977,939
|
117,878,634
|
94,350,887
|
|
Commercial
lines (in run-off effective July 2019)(2)
|
2,036,185
|
3,807,533
|
10,455,421
|
12,825,369
|
|
Total
gross premiums written
|
$46,024,151
|
$38,785,472
|
$128,334,055
|
$107,176,256
|
|
|
|
|
|
|
|
Net premiums written:
|
|
|
|
|
|
Personal
lines(3)
|
$35,442,970
|
$30,352,772
|
$89,287,063
|
$69,016,575
|
|
Livery
physical damage
|
2,590,434
|
2,363,844
|
8,199,269
|
7,142,413
|
|
Other(1)
|
400,317
|
73,449
|
522,596
|
169,709
|
|
Total
without commercial lines
|
38,433,721
|
32,790,065
|
98,008,928
|
76,328,697
|
|
Commercial
lines (in run-off effective July 2019)(2)
|
2,004,152
|
3,311,707
|
9,411,053
|
11,438,135
|
|
Total
net premiums written
|
$40,437,873
|
$36,101,772
|
$107,419,981
|
$87,766,832
|
|
|
|
|
|
|
|
Net premiums earned:
|
|
|
|
|
|
Personal
lines(3)
|
$27,487,526
|
$21,537,581
|
$75,737,374
|
$56,809,219
|
|
Livery
physical damage
|
2,712,283
|
2,398,005
|
7,850,822
|
7,320,065
|
|
Other(1)
|
275,324
|
56,091
|
392,745
|
150,942
|
|
Total
without commercial lines
|
30,475,133
|
23,991,677
|
83,980,941
|
64,280,226
|
|
Commercial
lines (in run-off effective July 2019)(2)
|
3,744,877
|
3,542,230
|
11,036,237
|
10,195,912
|
|
Total
net premiums earned
|
$34,220,010
|
$27,533,907
|
$95,017,178
|
$74,476,138
|
|
|
|
|
|
|
|
Net loss and loss adjustment expenses(4):
|
|
|
|
|
|
Personal
lines
|
$14,389,168
|
$9,652,796
|
$46,666,275
|
$31,096,528
|
|
Livery
physical damage
|
1,395,630
|
894,874
|
3,816,390
|
3,160,670
|
|
Other(1)
|
246,811
|
(63,570)
|
573,376
|
313,408
|
|
Unallocated
loss adjustment expenses
|
726,778
|
548,819
|
2,072,570
|
1,654,466
|
|
Total
without commercial lines
|
16,758,387
|
11,032,919
|
53,128,611
|
36,225,072
|
|
Commercial
lines (in run-off effective July 2019)(2)
|
8,022,931
|
2,263,789
|
18,459,239
|
5,514,051
|
|
Total
net loss and loss adjustment expenses
|
$24,781,318
|
$13,296,708
|
$71,587,850
|
$41,739,123
|
|
|
|
|
|
|
|
Net loss ratio(4):
|
|
|
|
|
|
Personal
lines
|
52.3%
|
44.8%
|
61.6%
|
54.7%
|
|
Livery
physical damage
|
51.5%
|
37.3%
|
48.6%
|
43.2%
|
|
Other(1)
|
89.6%
|
-113.3%
|
146.0%
|
207.6%
|
|
Total
without commercial lines
|
55.0%
|
46.0%
|
63.3%
|
56.4%
|
|
|
|
|
|
|
|
Commercial
lines (in run-off effective July 2019)(2)
|
214.2%
|
63.9%
|
167.3%
|
54.1%
|
|
Total
|
72.4%
|
48.3%
|
75.3%
|
56.0%
|
(1)
“Other”
includes, among other things, premiums and loss and loss adjustment
expenses from our participation in a mandatory state joint
underwriting association and loss and loss adjustment expenses from
commercial auto.
(2)
In July 2019, we
decided that we will no longer underwrite Commercial Liability
risks. See discussions above regarding the discontinuation of this
line of business.
(3)
See discussions
above with regard to “Net Written Premiums and Net Premiums
Earned”, as to changes in quota share ceding rates, effective
July 1, 2018 and 2017.
(4)
See discussions
above with regard to “Net Loss and LAE”, as to
catastrophe losses in the three and nine months ended September 30,
2019 and 2018.
54
Insurance Underwriting Business on a Standalone Basis
Our
insurance underwriting business reported on a standalone basis
for the periods indicated is as
follows:
|
|
Three months
ended
|
Nine months
ended
|
||
|
|
September 30,
|
September 30,
|
||
|
|
2019
|
2018
|
2019
|
2018
|
|
|
|
|
|
|
|
Revenues
|
|
|
|
|
|
Net
premiums earned
|
$34,220,010
|
$27,533,907
|
$95,017,178
|
$74,476,138
|
|
Ceding
commission revenue
|
1,029,582
|
1,044,529
|
2,982,960
|
4,430,855
|
|
Net
investment income
|
1,832,523
|
1,544,327
|
5,129,947
|
4,459,479
|
|
Net
gains (losses) on investments
|
995,040
|
346,300
|
3,652,189
|
(283,061)
|
|
Other
income
|
340,505
|
352,476
|
992,097
|
937,264
|
|
Total
revenues
|
38,417,660
|
30,821,539
|
107,774,371
|
84,020,675
|
|
|
|
|
|
|
|
Expenses
|
|
|
|
|
|
Loss
and loss adjustment expenses
|
24,781,318
|
13,296,708
|
71,587,850
|
41,739,123
|
|
Commission
expense
|
7,779,344
|
6,594,323
|
21,931,933
|
18,411,460
|
|
Other
underwriting expenses
|
6,430,734
|
5,193,679
|
17,983,174
|
15,301,168
|
|
Depreciation
and amortization
|
622,222
|
440,383
|
1,804,265
|
1,273,975
|
|
Total
expenses
|
39,613,618
|
25,525,093
|
113,307,222
|
76,725,726
|
|
|
|
|
|
|
|
(Loss)
income from operations
|
(1,195,958)
|
5,296,446
|
(5,532,851)
|
7,294,949
|
|
Income
tax (benefit) expense
|
(293,183)
|
1,075,104
|
(1,251,113)
|
1,452,750
|
|
Net (loss) income
|
$(902,775)
|
$4,221,342
|
$(4,281,738)
|
$5,842,199
|
|
|
|
|
|
|
|
|
|
|
|
|
|
Key Measures:
|
|
|
|
|
|
Net
loss ratio
|
72.4%
|
48.3%
|
75.3%
|
56.0%
|
|
Net
underwriting expense ratio
|
37.5%
|
37.7%
|
37.8%
|
38.1%
|
|
Net
combined ratio
|
109.9%
|
86.0%
|
113.1%
|
94.1%
|
|
|
|
|
|
|
|
Reconciliation
of net underwriting expense ratio:
|
|
|
|
|
|
Acquisition
costs and other
|
|
|
|
|
|
underwriting
expenses
|
$14,210,078
|
$11,788,002
|
$39,915,107
|
$33,712,628
|
|
Less:
Ceding commission revenue
|
(1,029,582)
|
(1,044,529)
|
(2,982,960)
|
(4,430,855)
|
|
Less:
Other income
|
(340,505)
|
(352,476)
|
(992,097)
|
(937,264)
|
|
Net
underwriting expenses
|
$12,839,991
|
$10,390,997
|
$35,940,050
|
$28,344,509
|
|
|
|
|
|
|
|
Net
premiums earned
|
$34,220,010
|
$27,533,907
|
$95,017,178
|
$74,476,138
|
|
|
|
|
|
|
|
Net
Underwriting Expense Ratio
|
37.5%
|
37.7%
|
37.8%
|
38.1%
|
55
An
analysis of our direct, assumed and ceded earned premiums, loss and
loss adjustment expenses, and loss ratios is shown
below:
|
|
Direct
|
Assumed
|
Ceded
|
Net
|
|
|
|
|
|
|
|
Nine months ended September 30, 2019
|
|
|
|
|
|
Written
premiums
|
$128,333,117
|
$938
|
$(20,914,074)
|
$107,419,981
|
|
Change
in unearned premiums
|
(11,035,993)
|
(559)
|
(1,366,251)
|
(12,402,803)
|
|
Earned
premiums
|
$117,297,124
|
$379
|
$(22,280,325)
|
$95,017,178
|
|
|
|
|
|
|
|
Loss
and loss adjustment expenses exluding
|
|
|
|
|
|
the
effect of catastrophes
|
$72,683,118
|
$(917)
|
$(8,041,028)
|
$64,641,173
|
|
Catastrophe
loss
|
7,755,089
|
-
|
(808,412)
|
6,946,677
|
|
Loss
and loss adjustment expenses
|
$80,438,207
|
$(917)
|
$(8,849,440)
|
$71,587,850
|
|
|
|
|
|
|
|
Loss
ratio excluding the effect of catastrophes
|
62.0%
|
-242.0%
|
36.1%
|
68.0%
|
|
Catastrophe
loss
|
6.6%
|
0.0%
|
3.6%
|
7.3%
|
|
Loss
ratio
|
68.6%
|
-242.0%
|
39.7%
|
75.3%
|
|
|
|
|
|
|
|
Nine months ended September 30, 2018
|
|
|
|
|
|
Written
premiums
|
$107,175,413
|
$842
|
$(19,409,423)
|
$87,766,832
|
|
Change
in unearned premiums
|
(9,930,503)
|
3,762
|
(3,363,953)
|
(13,290,694)
|
|
Earned
premiums
|
$97,244,910
|
$4,604
|
$(22,773,376)
|
$74,476,138
|
|
|
|
|
|
|
|
Loss
and loss adjustment expenses exluding
|
|
|
|
|
|
the
effect of catastrophes
|
$42,575,980
|
$27,037
|
$(6,983,566)
|
$35,619,451
|
|
Catastrophe
loss
|
10,804,633
|
-
|
(4,684,961)
|
6,119,672
|
|
Loss
and loss adjustment expenses
|
$53,380,613
|
$27,037
|
$(11,668,527)
|
$41,739,123
|
|
|
|
|
|
|
|
Loss
ratio excluding the effect of catastrophes
|
43.8%
|
587.3%
|
30.7%
|
47.8%
|
|
Catastrophe
loss
|
11.1%
|
0.0%
|
20.5%
|
8.2%
|
|
Loss
ratio
|
54.9%
|
587.3%
|
51.2%
|
56.0%
|
|
|
|
|
|
|
|
Three months ended September 30, 2019
|
|
|
|
|
|
Written
premiums
|
$46,023,290
|
$861
|
$(5,586,278)
|
$40,437,873
|
|
Change
in unearned premiums
|
(4,579,777)
|
(761)
|
(1,637,325)
|
(6,217,863)
|
|
Earned
premiums
|
$41,443,513
|
$100
|
$(7,223,603)
|
$34,220,010
|
|
|
|
|
|
|
|
Loss
and loss adjustment expenses exluding
|
|
|
|
|
|
the
effect of catastrophes
|
$26,516,544
|
$1,164
|
$(2,182,511)
|
$24,335,197
|
|
Catastrophe
loss
|
491,362
|
-
|
(45,241)
|
446,121
|
|
Loss
and loss adjustment expenses
|
$27,007,906
|
$1,164
|
$(2,227,752)
|
$24,781,318
|
|
|
|
|
|
|
|
Loss
ratio excluding the effect of catastrophes
|
64.0%
|
1164.0%
|
30.2%
|
71.1%
|
|
Catastrophe
loss
|
1.2%
|
0.0%
|
0.6%
|
1.3%
|
|
Loss
ratio
|
65.2%
|
1164.0%
|
30.8%
|
72.4%
|
|
|
|
|
|
|
|
Three months ended September 30, 2018
|
|
|
|
|
|
Written
premiums
|
$38,785,453
|
$18
|
$(2,683,699)
|
$36,101,772
|
|
Change
in unearned premiums
|
(4,435,174)
|
698
|
(4,133,389)
|
(8,567,865)
|
|
Earned
premiums
|
$34,350,279
|
$716
|
$(6,817,088)
|
$27,533,907
|
|
|
|
|
|
|
|
Loss
and loss adjustment expenses exluding
|
|
|
|
|
|
the
effect of catastrophes
|
$16,700,865
|
$4,104
|
$(3,797,536)
|
$12,907,433
|
|
Catastrophe
loss
|
243,244
|
-
|
146,031
|
389,275
|
|
Loss
and loss adjustment expenses
|
$16,944,109
|
$4,104
|
$(3,651,505)
|
$13,296,708
|
|
|
|
|
|
|
|
Loss
ratio excluding the effect of catastrophes
|
48.6%
|
573.2%
|
55.7%
|
46.9%
|
|
Catastrophe
loss
|
0.7%
|
0.0%
|
-2.1%
|
1.4%
|
|
Loss
ratio
|
49.3%
|
573.2%
|
53.6%
|
48.3%
|
56
The key
measures for our insurance underwriting business for the periods
indicated are as follows:
|
|
Three
months ended
|
Nine
months ended
|
||
|
|
September
30,
|
September
30,
|
||
|
|
2019
|
2018
|
2019
|
2018
|
|
|
|
|
|
|
|
Net
premiums earned
|
$34,220,010
|
$27,533,907
|
$95,017,178
|
$74,476,138
|
|
Ceding
commission revenue
|
1,029,582
|
1,044,529
|
2,982,960
|
4,430,855
|
|
Other
income
|
340,505
|
352,476
|
992,097
|
937,264
|
|
|
|
|
|
|
|
Loss
and loss adjustment expenses (1)
|
24,781,318
|
13,296,708
|
71,587,850
|
41,739,123
|
|
|
|
|
|
|
|
Acquistion costs and other underwriting expenses:
|
|
|
|
|
|
Commission
expense
|
7,779,344
|
6,594,323
|
21,931,933
|
18,411,460
|
|
Other
underwriting expenses
|
6,430,734
|
5,193,679
|
17,983,174
|
15,301,168
|
|
Total
acquistion costs and other
|
|
|
|
|
|
underwriting
expenses
|
14,210,078
|
11,788,002
|
39,915,107
|
33,712,628
|
|
|
|
|
|
|
|
Underwriting
(loss) income
|
$(3,401,299)
|
$3,846,202
|
$(12,510,722)
|
$4,392,506
|
|
|
|
|
|
|
|
Key
Measures:
|
|
|
|
|
|
Net
loss ratio excluding the effect of catastrophes
|
71.1%
|
46.9%
|
68.0%
|
47.8%
|
|
Effect
of catastrophe loss on net loss ratio (1)
|
1.3%
|
1.4%
|
7.3%
|
8.2%
|
|
Net
loss ratio
|
72.4%
|
48.3%
|
75.3%
|
56.0%
|
|
|
|
|
|
|
|
Net
underwriting expense ratio excluding the
|
|
|
|
|
|
effect
of catastrophes
|
37.5%
|
37.7%
|
37.8%
|
37.5%
|
|
Effect
of catastrophe loss on net underwriting
|
|
|
|
|
|
expense
ratio (2)
|
0.0%
|
0.0%
|
0.0%
|
0.6%
|
|
Net
underwriting expense ratio
|
37.5%
|
37.7%
|
37.8%
|
38.1%
|
|
|
|
|
|
|
|
Net
combined ratio excluding the effect
|
|
|
|
|
|
of
catastrophes
|
108.6%
|
84.6%
|
105.8%
|
85.3%
|
|
Effect
of catastrophe loss on net combined
|
|
|
|
|
|
ratio
(1) (2)
|
1.3%
|
1.4%
|
7.3%
|
8.8%
|
|
Net
combined ratio
|
109.9%
|
86.0%
|
113.1%
|
94.1%
|
|
|
|
|
|
|
|
Reconciliation
of net underwriting expense ratio:
|
|
|
|
|
|
Acquisition
costs and other
|
|
|
|
|
|
underwriting
expenses
|
$14,210,078
|
$11,788,002
|
$39,915,107
|
$33,712,628
|
|
Less:
Ceding commission revenue (2)
|
(1,029,582)
|
(1,044,529)
|
(2,982,960)
|
(4,430,855)
|
|
Less:
Other income
|
(340,505)
|
(352,476)
|
(992,097)
|
(937,264)
|
|
|
$12,839,991
|
$10,390,997
|
$35,940,050
|
$28,344,509
|
|
|
|
|
|
|
|
Net
earned premium
|
$34,220,010
|
$27,533,907
|
$95,017,178
|
$74,476,138
|
|
|
|
|
|
|
|
Net
Underwriting Expense Ratio
|
37.5%
|
37.7%
|
37.8%
|
38.1%
|
(1) For
the three months ended September 30, 2019 and 2018, includes the
sum of net catastrophe losses and loss adjustment expenses of
$446,121and $389,276, respectively. For the nine months ended
September 30, 2019 and 2018, includes the sum of net catastrophe
losses and loss adjustment expenses of $6,946,677 and $6,119,672,
respectively.
(2) For
the nine months ended September 30, 2018, the effect of catastrophe
loss on our net underwriting expense ratio includes the effect of
reduced contingent ceding commission revenue by $459,068 and does
not include the indirect effects of a $267,508 decrease in other
underwriting expenses.
57
Investments
Portfolio Summary
Fixed-Maturity Securities
The
following table presents a breakdown of the amortized cost,
estimated fair value, and unrealized gains and losses of our
investments in fixed-maturity securities classified as
available-for-sale as of September 30, 2019 and December 31,
2018:
|
|
September
30, 2019
|
|||||
|
|
|
|
|
|
|
|
|
|
Cost
or
|
Gross
|
Gross
Unrealized Losses
|
Estimated
|
%
of
|
|
|
|
Amortized
|
Unrealized
|
Less
than 12
|
More
than 12
|
Fair
|
Estimated
|
|
Category
|
Cost
|
Gains
|
Months
|
Months
|
Value
|
Fair
Value
|
|
|
|
|
|
|
|
|
|
U.S.
Treasury securities and
|
|
|
|
|
|
|
|
obligations
of U.S. government
|
|
|
|
|
|
|
|
corporations
and agencies
|
$8,243,486
|
$156,066
|
$-
|
$-
|
$8,399,552
|
5.1%
|
|
|
|
|
|
|
|
|
|
Political
subdivisions of States,
|
|
|
|
|
|
|
|
Territories
and Possessions
|
5,662,999
|
187,006
|
-
|
-
|
5,850,005
|
3.5%
|
|
|
|
|
|
|
|
|
|
Corporate
and other bonds
|
|
|
|
|
|
|
|
Industrial
and miscellaneous
|
124,956,806
|
5,365,954
|
(33,073)
|
(20,893)
|
130,268,794
|
78.3%
|
|
|
|
|
|
|
|
|
|
Residential
mortgage and other
|
|
|
|
|
|
|
|
asset
backed securities (1)
|
21,737,713
|
297,257
|
(19,924)
|
(312,685)
|
21,702,361
|
13.1%
|
|
Total
fixed-maturity securities
|
$160,601,004
|
$6,006,283
|
$(52,997)
|
$(333,578)
|
$166,220,712
|
100.0%
|
(1)
In
2017, KICO placed certain residential mortgage backed securities as
eligible collateral in a designated custodian account related to
its membership in the Federal Home Loan Bank of New York
("FHLBNY"). The eligible collateral would be pledged to FHLBNY if
KICO draws an advance from the FHLBNY credit line. As of September
30, 2019, the estimated fair value of the eligible investments was
approximately $5,144,000. KICO will retain all rights regarding all
securities if pledged as collateral. As of September 30, 2019,
there was no outstanding balance on the FHLBNY credit
line.
|
|
December
31, 2018
|
|||||
|
|
|
|
|
|
|
|
|
|
Cost
or
|
Gross
|
Gross
Unrealized Losses
|
Estimated
|
%
of
|
|
|
|
Amortized
|
Unrealized
|
Less
than 12
|
More
than 12
|
Fair
|
Estimated
|
|
Category
|
Cost
|
Gains
|
Months
|
Months
|
Value
|
Fair
Value
|
|
|
|
|
|
|
|
|
|
U.S.
Treasury securities and
|
|
|
|
|
|
|
|
obligations
of U.S. government
|
|
|
|
|
|
|
|
corporations
and agencies
|
$8,222,050
|
$26,331
|
$(28,000)
|
$-
|
$8,220,381
|
5.4%
|
|
|
|
|
|
|
|
|
|
Political subdivisions of States,
|
|
|
|
|
|
|
|
Territories
and Possessions
|
6,339,540
|
50,903
|
(12,327)
|
(36,508)
|
6,341,608
|
4.2%
|
|
|
|
|
|
|
|
|
|
Corporate
and other bonds
|
|
|
|
|
|
|
|
Industrial
and miscellaneous
|
119,078,698
|
123,740
|
(2,775,540)
|
(676,605)
|
115,750,293
|
76.3%
|
|
|
|
|
|
|
|
|
|
Residential mortgage and other
|
|
|
|
|
|
|
|
asset
backed securities (1)
|
21,790,973
|
236,502
|
(231,229)
|
(331,012)
|
21,465,234
|
14.1%
|
|
Total
fixed-maturity securities
|
$155,431,261
|
$437,476
|
$(3,047,096)
|
$(1,044,125)
|
$151,777,516
|
100.0%
|
(1)
In
2017, KICO placed certain residential mortgage backed securities as
eligible collateral in a designated custodian account related to
its relationship with the Federal Home Loan Bank of New York
("FHLBNY"). The eligible collateral would be pledged to FHLBNY if
KICO draws an advance from FHLBNY. As of December 31, 2018, the
estimated fair value of the eligible investments was $5,116,000.
KICO will retain all rights regarding all securities if pledged as
collateral. As of December 31, 2018, there was no outstanding
balance on the FHLBNY credit line.
58
Equity Securities
The
following table presents a breakdown of the cost, estimated fair
value, and gross gains and losses of investments in equity
securities as of September 30, 2019 and December 31,
2018:
|
|
September
30, 2019
|
||||
|
|
|
|
|
Estimated
|
%
of
|
|
|
|
Gross
|
Gross
|
Fair
|
Estimated
|
|
Category
|
Cost
|
Gains
|
Losses
|
Value
|
Fair
Value
|
|
|
|
|
|
|
|
|
Equity Securities:
|
|
|
|
|
|
|
Preferred
stocks
|
$8,415,227
|
$394,815
|
$(16,042)
|
$8,794,000
|
37.4%
|
|
Common stocks and exchange
|
|
|
|
|
|
|
traded
mutual funds
|
13,655,339
|
1,537,211
|
(487,351)
|
14,705,199
|
62.6%
|
|
Total
|
$22,070,566
|
$1,932,026
|
$(503,393)
|
$23,499,199
|
100.0%
|
|
|
December
31, 2018
|
||||
|
|
|
|
|
Estimated
|
%
of
|
|
|
|
Gross
|
Gross
|
Fair
|
Estimated
|
|
Category
|
Cost
|
Gains
|
Losses
|
Value
|
Fair
Value
|
|
|
|
|
|
|
|
|
Equity Securities:
|
|
|
|
|
|
|
Preferred
stocks
|
$6,694,754
|
$-
|
$(541,798)
|
$6,152,956
|
37.1%
|
|
Common stocks and exchange
|
|
|
|
|
|
|
traded
mutual funds
|
11,611,232
|
99,817
|
(1,291,389)
|
10,419,660
|
62.9%
|
|
Total
|
$18,305,986
|
$99,817
|
$(1,833,187)
|
$16,572,616
|
100.0%
|
Other Investments
Pursuant to ASC 820 “Fair Value
Measurement,” an entity is permitted, as a practical
expedient, to estimate the fair value of an investment within the
scope of ASC 820 using the net asset value (“NAV”) per
share (or its equivalent) of the investment. The following
table presents a breakdown of the cost, estimated fair value, and
gross unrealized gains and losses of our other investments as of
September 30, 2019 and December 31, 2018:
|
|
September
30, 2019
|
December
31, 2018
|
||||
|
|
|
Gross
|
Estimated
|
|
Gross
|
Estimated
|
|
Category
|
Cost
|
Gains
|
Fair
Value
|
Cost
|
Losses
|
Fair
Value
|
|
|
|
|
|
|
|
|
|
Other Investments:
|
|
|
|
|
|
|
|
Hedge
fund
|
$1,999,381
|
$426,523
|
$2,425,904
|
$1,999,381
|
$(144,156)
|
$1,855,225
|
|
Total
|
$1,999,381
|
$426,523
|
$2,425,904
|
$1,999,381
|
$(144,156)
|
$1,855,225
|
Held-to-Maturity Securities
The
following table presents a breakdown of the amortized cost,
estimated fair value, and unrealized gains and losses of
investments in held-to-maturity securities as of September 30, 2019
and December 31, 2018:
|
|
September 30, 2019
|
|||||
|
|
|
|
|
|
|
|
|
|
Cost or
|
Gross
|
Gross Unrealized Losses
|
Estimated
|
% of
|
|
|
|
Amortized
|
Unrealized
|
Less than 12
|
More than 12
|
Fair
|
Estimated
|
|
Category
|
Cost
|
Gains
|
Months
|
Months
|
Value
|
Fair Value
|
|
|
|
|
|
|
|
|
|
U.S.
Treasury securities
|
$729,539
|
$153,088
|
$-
|
$-
|
$882,627
|
21.4%
|
|
|
|
|
|
|
|
|
|
Political subdivisions of States,
|
|
|
|
|
|
|
|
Territories
and Possessions
|
998,668
|
50,357
|
-
|
-
|
1,049,025
|
25.4%
|
|
|
|
|
|
|
|
|
|
Corporate
and other bonds
|
|
|
|
|
|
|
|
Industrial
and miscellaneous
|
2,097,298
|
98,434
|
-
|
-
|
2,195,732
|
53.2%
|
|
|
|
|
|
|
|
|
|
Total
|
$3,825,505
|
$301,879
|
$-
|
$-
|
$4,127,384
|
100.0%
|
59
|
|
December
31, 2018
|
|||||
|
|
|
|
|
|
|
|
|
|
Cost
or
|
Gross
|
Gross
Unrealized Losses
|
Estimated
|
%
of
|
|
|
|
Amortized
|
Unrealized
|
Less
than 12
|
More
than 12
|
Fair
|
Estimated
|
|
Category
|
Cost
|
Gains
|
Months
|
Months
|
Value
|
Fair
Value
|
|
|
|
|
|
|
|
|
|
U.S.
Treasury securities
|
$729,507
|
$147,532
|
$(3,964)
|
$-
|
$873,075
|
19.7%
|
|
|
|
|
|
|
|
|
|
Political subdivisions of States,
|
|
|
|
|
|
|
|
Territories
and Possessions
|
998,803
|
33,862
|
-
|
-
|
1,032,665
|
23.3%
|
|
|
|
|
|
|
|
|
|
Corporate
and other bonds
|
|
|
|
|
|
|
|
Industrial
and miscellaneous
|
2,494,545
|
38,461
|
(1,425)
|
(10,905)
|
2,520,676
|
57.0%
|
|
|
|
|
|
|
|
|
|
Total
|
$4,222,855
|
$219,855
|
$(5,389)
|
$(10,905)
|
$4,426,416
|
100.0%
|
Held-to-maturity U.S. Treasury securities are held in trust
pursuant to various states’ minimum fund
requirements.
A summary of the amortized cost and fair value of our investments
in held-to-maturity securities by contractual maturity as of
September 30, 2019 and December 31, 2018 is shown below:
|
|
September
30, 2019
|
December
31, 2018
|
||
|
|
Amortized
|
Estimated
|
Amortized
|
Estimated
|
|
Remaining Time to
Maturity
|
Cost
|
Fair Value
|
Cost
|
Fair Value
|
|
|
|
|
|
|
|
Less
than one year
|
$623,000
|
$629,143
|
$-
|
$-
|
|
One
to five years
|
2,098,950
|
2,214,947
|
2,996,685
|
3,036,531
|
|
Five
to ten years
|
497,016
|
529,255
|
619,663
|
635,846
|
|
More
than 10 years
|
606,539
|
754,039
|
606,507
|
754,039
|
|
Total
|
$3,825,505
|
$4,127,384
|
$4,222,855
|
$4,426,416
|
Credit Rating of Fixed-Maturity
Securities
The
table below summarizes the credit quality of our available-for-sale
fixed-maturity securities as of September 30, 2019 and
December 31, 2018 as rated by Standard & Poor’s (or,
if unavailable from Standard & Poor’s, then Moody’s
or Fitch):
|
|
September
30, 2019
|
December
31, 2018
|
||
|
|
Estimated
|
Percentage
of
|
Estimated
|
Percentage
of
|
|
|
Fair
Market
|
Fair
Market
|
Fair
Market
|
Fair
Market
|
|
|
Value
|
Value
|
Value
|
Value
|
|
|
|
|
|
|
|
Rating
|
|
|
|
|
|
U.S.
Treasury securities
|
$8,399,552
|
5.1%
|
$8,220,381
|
5.4%
|
|
|
|
|
|
|
|
Corporate
and municipal bonds
|
|
|
|
|
|
AAA
|
979,300
|
0.6%
|
979,123
|
0.6%
|
|
AA
|
7,414,656
|
4.5%
|
8,350,910
|
5.5%
|
|
A
|
35,473,122
|
21.3%
|
27,665,961
|
18.2%
|
|
BBB
|
92,251,719
|
55.5%
|
85,095,907
|
56.1%
|
|
Total
corporate and municipal bonds
|
136,118,797
|
81.9%
|
122,091,901
|
80.4%
|
|
|
|
|
|
|
|
Residential
mortgage backed securities
|
|
|
|
|
|
AAA
|
1,000,077
|
0.6%
|
999,640
|
0.7%
|
|
AA
|
16,706,728
|
10.1%
|
12,743,906
|
8.5%
|
|
A
|
1,530,921
|
0.9%
|
4,777,356
|
3.1%
|
|
CCC
|
1,224,118
|
0.7%
|
1,440,825
|
0.9%
|
|
CC
|
89,808
|
0.1%
|
109,648
|
0.1%
|
|
C
|
20,029
|
0.0%
|
24,050
|
0.0%
|
|
D
|
221,766
|
0.1%
|
390,542
|
0.3%
|
|
Non
rated
|
908,915
|
0.5%
|
979,267
|
0.6%
|
|
Total
residential mortgage backed securities
|
21,702,362
|
13.0%
|
21,465,234
|
14.2%
|
|
|
|
|
|
|
|
Total
|
$166,220,711
|
100.0%
|
$151,777,516
|
100.0%
|
60
The
table below summarizes the average yield by type of fixed-maturity
security as of September 30, 2019 and December 31,
2018:
|
Category
|
September
30, 2019
|
December
31, 2018
|
|
U.S.
Treasury securities and
|
|
|
|
obligations
of U.S. government
|
|
|
|
corporations
and agencies
|
2.13%
|
2.20%
|
|
|
|
|
|
Political
subdivisions of States,
|
|
|
|
Territories
and Possessions
|
3.48%
|
3.62%
|
|
|
|
|
|
Corporate
and other bonds
|
|
|
|
Industrial
and miscellaneous
|
3.73%
|
4.11%
|
|
|
|
|
|
Residential
mortgage and other asset backed securities
|
2.44%
|
1.94%
|
|
|
|
|
|
Total
|
3.47%
|
3.68%
|
The
table below lists the weighted average maturity and effective
duration in years on our fixed-maturity securities as of September
30, 2019 and December 31, 2018:
|
|
September
30, 2019
|
December
31, 2018
|
|
Weighted
average effective maturity
|
4.8
|
5.6
|
|
|
|
|
|
Weighted
average final maturity
|
6.3
|
6.9
|
|
|
|
|
|
Effective
duration
|
4.3
|
4.6
|
Fair Value Consideration
As
disclosed in Note 4 to the condensed consolidated financial
statements, with respect to “Fair Value Measurements,”
we define fair value as the price that would be received to sell an
asset or paid to transfer a liability in a transaction involving
identical or comparable assets or liabilities between market
participants (an “exit price”). The fair value
hierarchy distinguishes between inputs based on market data from
independent sources (“observable inputs”) and a
reporting entity’s internal assumptions based upon the best
information available when external market data is limited or
unavailable (“unobservable inputs”). The fair value
hierarchy prioritizes fair value measurements into three levels
based on the nature of the inputs. Quoted prices in active markets
for identical assets have the highest priority (“Level
1”), followed by observable inputs other than quoted prices
including prices for similar but not identical assets or
liabilities (“Level 2”), and unobservable inputs,
including the reporting entity’s estimates of the assumption
that market participants would use, having the lowest priority
(“Level 3”). As of September 30, 2019 and
December 31, 2018, 84% and 81%, respectively, of the
investment portfolio recorded at fair value was priced based upon
quoted market prices.
The
table below summarizes the gross unrealized losses of our
fixed-maturity securities available-for-sale and equity securities
by length of time the security has continuously been in an
unrealized loss position as of September 30, 2019 and
December 31, 2018:
61
|
|
September 30,
2019
|
|||||||
|
|
Less than 12
months
|
12 months or
more
|
Total
|
|||||
|
|
Estimated
|
|
No. of
|
Estimated
|
|
No. of
|
Estimated
|
|
|
|
Fair
|
Unrealized
|
Positions
|
Fair
|
Unrealized
|
Positions
|
Fair
|
Unrealized
|
|
Category
|
Value
|
Losses
|
Held
|
Value
|
Losses
|
Held
|
Value
|
Losses
|
|
|
|
|
|
|
|
|
|
|
|
Fixed-Maturity Securities:
|
|
|
|
|
|
|
|
|
|
U.S.
Treasury securities
|
|
|
|
|
|
|
|
|
|
and
obligations of U.S.
|
|
|
|
|
|
|
|
|
|
government
corporations
|
|
|
|
|
|
|
|
|
|
and
agencies
|
$-
|
$-
|
-
|
$0
|
$-
|
-
|
$-
|
$-
|
|
|
|
|
|
|
|
|
|
|
|
Political
subdivisions of
|
|
|
|
|
|
|
|
|
|
States,
Territories and
|
|
|
|
|
|
|
|
|
|
Possessions
|
-
|
-
|
-
|
-
|
-
|
-
|
-
|
-
|
|
|
|
|
|
|
|
|
|
|
|
Corporate
and other
|
|
|
|
|
|
|
|
|
|
bonds
industrial and
|
|
|
|
|
|
|
|
|
|
miscellaneous
|
3,258,185
|
(33,073)
|
6
|
3,170,889
|
(20,893)
|
6
|
6,429,074
|
(53,966)
|
|
|
|
|
|
|
|
|
|
|
|
Residential mortgage and
other
|
|
|
|
|
|
|
|
|
|
asset
backed securities
|
3,008,874
|
(19,924)
|
3
|
15,596,316
|
(312,685)
|
23
|
18,605,190
|
(332,609)
|
|
|
|
|
|
|
|
|
|
|
|
Total
fixed-maturity
|
|
|
|
|
|
|
|
|
|
securities
|
$6,267,059
|
$(52,997)
|
9
|
$18,767,205
|
$(333,578)
|
29
|
$25,034,264
|
$(386,575)
|
|
|
December
31, 2018
|
|||||||
|
|
Less
than 12 months
|
12
months or more
|
Total
|
|||||
|
|
Estimated
|
|
No.
of
|
Estimated
|
|
No.
of
|
Aggregate
|
|
|
|
Fair
|
Unrealized
|
Positions
|
Fair
|
Unrealized
|
Positions
|
Fair
|
Unrealized
|
|
Category
|
Value
|
Losses
|
Held
|
Value
|
Losses
|
Held
|
Value
|
Losses
|
|
|
|
|
|
|
|
|
|
|
|
Fixed-Maturity Securities:
|
|
|
|
|
|
|
|
|
|
U.S.
Treasury securities
|
|
|
|
|
|
|
|
|
|
and
obligations of U.S.
|
|
|
|
|
|
|
|
|
|
government
corporations
|
|
|
|
|
|
|
|
|
|
and
agencies
|
$4,948,530
|
$(28,000)
|
3
|
$-
|
$-
|
-
|
$4,948,530
|
$(28,000)
|
|
|
|
|
|
|
|
|
|
|
|
Political
subdivisions of
|
|
|
|
|
|
|
|
|
|
States,
Territories and
|
|
|
|
|
|
|
|
|
|
Possessions
|
555,375
|
(12,327)
|
1
|
1,436,242
|
(36,508)
|
3
|
1,991,617
|
(48,835)
|
|
|
|
|
|
|
|
|
|
|
|
Corporate
and other
|
|
|
|
|
|
|
|
|
|
bonds
industrial and
|
|
|
|
|
|
|
|
|
|
miscellaneous
|
81,004,459
|
(2,775,540)
|
97
|
13,424,888
|
(676,605)
|
24
|
94,429,347
|
(3,452,145)
|
|
|
|
|
|
|
|
|
|
|
|
Residential mortgage and other
|
|
|
|
|
|
|
|
|
|
asset
backed securities
|
7,002,713
|
(231,229)
|
9
|
11,928,425
|
(331,012)
|
19
|
18,931,138
|
(562,241)
|
|
|
|
|
|
|
|
|
|
|
|
Total
fixed-maturity
|
|
|
|
|
|
|
|
|
|
securities
|
$93,511,077
|
$(3,047,096)
|
110
|
$26,789,555
|
$(1,044,125)
|
46
|
$120,300,632
|
$(4,091,221)
|
62
There were 38
securities at September 30, 2019 that accounted for the gross
unrealized loss of our fixed-maturity securities
available-for-sale, none of which were deemed by us to be other
than temporarily impaired. There were 156 securities at December
31, 2018 that accounted for the gross unrealized loss, none of
which were deemed by us to be other than temporarily impaired.
Significant factors influencing our determination that unrealized
losses were temporary included the magnitude of the unrealized
losses in relation to each security’s cost, the nature of the
investment and management’s intent not to sell these
securities and it being not more likely than not that we will be
required to sell these investments before anticipated recovery of
fair value to our cost basis.
Liquidity and Capital Resources
Cash Flows
The
primary sources of cash flow are from our insurance underwriting
subsidiary, KICO, and include direct premiums written, ceding
commissions from our quota share reinsurers, loss recovery payments
from our reinsurers, investment income and proceeds from the sale
or maturity of investments. Funds are used by KICO for ceded
premium payments to reinsurers, which are paid on a net basis after
subtracting losses paid on reinsured claims and reinsurance
commissions. KICO also uses funds for loss payments and loss
adjustment expenses on our net business, commissions to producers,
salaries and other underwriting expenses as well as to purchase
investments and fixed assets.
For the
nine months ended September 30, 2019, the primary source of cash
flow for our holding company was the dividends received from KICO,
subject to statutory restrictions. For the nine months ended
September 30, 2019, KICO paid dividends of $5,500,000 to
us.
KICO is
a member of the Federal Home Loan Bank of New York
(“FHLBNY”), which provides additional access to
liquidity. Members have access to a variety of flexible, low cost
funding through FHLBNY’s credit products, enabling members to
customize advances. Advances are to be fully collateralized;
eligible collateral to pledge to FHLBNY includes residential and
commercial mortgage backed securities, along with U.S. Treasury and
agency securities. See Note 3 to our consolidated financial
statements – Investments, for eligible collateral held in a
designated custodian account available for future advances.
Advances are limited to 5% of KICO’s net admitted assets as
of the end of the previous quarter, which isJune 30, 2019, and are
due and payable within one year of borrowing. The maximum allowable
advance as of September 30, 2019, based on the net admitted assets
as of June 30, 2019, was approximately $11,502,000. Advances are
limited to 90% of the amount of available collateral, which was
approximately $4,630,000 as of September 30, 2019. There were no
borrowings under this facility during the nine months ended
September 30, 2019.
As of
September 30, 2019, invested assets and cash in our holding company
totaled approximately $5,616,000. If the aforementioned sources of
cash flow currently available are insufficient to cover our holding
company cash requirements, we will seek to obtain additional
financing.
Our
reconciliation of net income to net cash provided by operations is
generally influenced by the collection of premiums in advance of
paid losses, the timing of reinsurance, issuing company settlements
and loss payments.
Cash
flow and liquidity are categorized into three sources:
(1) operating activities; (2) investing activities; and
(3) financing activities, which are shown in the following
table:
|
Nine Months Ended September 30,
|
2019
|
2018
|
|
|
|
|
|
Cash
flows provided by (used in):
|
|
|
|
Operating
activities
|
$19,537,965
|
$18,197,327
|
|
Investing
activities
|
(12,085,316)
|
(32,299,835)
|
|
Financing
activities
|
(2,952,002)
|
(4,385,449)
|
|
Net increase (decrease) in cash and cash
equivalents
|
4,500,647
|
(18,487,957)
|
|
Cash
and cash equivalents, beginning of period
|
21,138,403
|
48,381,633
|
|
Cash and cash equivalents, end of period
|
$25,639,050
|
$29,893,676
|
Net
cash provided by operating activities was $19,538,000 in Nine
Months 2019 as compared to $18,197,000 provided in Nine Months
2018. The $1,341,000 increase in cash flows provided by operating
activities in Nine Months 2019 was primarily a result of an
increase in cash arising from net fluctuations in assets and
liabilities, partially offset by a decrease in net income (adjusted
for non-cash items) of $16,409,000. The net fluctuations in assets
and liabilities are related to operating activities of KICO as
affected by the growth in its operations which are described
above.
Net
cash used in investing activities was $12,085,000 in Nine Months
2019 compared to $32,300,000 used in Nine Months 2018. The
$20,215,000 decrease in net cash used in investing activities was
the result of a $32,284,000 decrease in acquisitions of invested
assets, partially offset by a $10,882,000 decrease in sales or
maturities of invested assets and a $1,187,000 increase in fixed
asset acquisitions in Nine Months 2019.
Net
cash used in financing activities was $2,952,000 in Nine Months
2019 compared to $4,385,000 used in Nine Months 2018. The
$1,433,000 decrease in net cash used in financing activities was
attributable to higher dividends and withholding taxes paid on net
exercises of stock options paid in the prior year and a purchase of
$540,000 in treasury stock in Nine Months 2018 as compared to none
in Nine Months 2019.
63
Reinsurance
Our
quota share reinsurance treaties are on a July 1 through June 30
fiscal year basis; therefore, for year to date fiscal periods after
June 30, two separate treaties will be included in such
periods.
Our
quota share reinsurance treaties in effect during the nine months
ended September 30, 2019 and 2018 for our personal lines business,
which primarily consists of homeowners’ policies, were
covered under a treaty covering a two-year period from July 1, 2017
through June 30, 2019 (“2017/2019 Treaty”). The treaty
in effect during the nine months ended September 30, 2019 was
covered under the July 1, 2018 through June 30, 2019 treaty year
(“2018/2019 Treaty Year”). The treaty in effect during
the nine months ended September 30, 2018 was covered under the July
1, 2017 through June 30, 2018 treaty year (“2017/2018 Treaty
Year”) and the 2018/2019 Treaty Year that began on July 1,
2018.
In
August 2018, we terminated our contract with one of the reinsurers
that was a party to the 2017/2019 Treaty. This termination was
retroactive to July 1, 2018 and had the effect of reducing the
quota share ceding rate to 10% under the 2018/2019 Treaty Year from
20% under the 2017/2018 Treaty Year.
Effective
July 1, 2019, our 2017/2019 Treaty and commercial umbrella treaty
expired on a run-off basis; these treaties were not renewed. We
entered into new excess of loss and catastrophe reinsurance
treaties effective July 1, 2019. Material terms for our reinsurance
treaties in effect for the treaty years shown below are as
follows:
|
|
Treaty
Year
|
||
|
|
July 1,
2019
|
July 1,
2018
|
July 1,
2017
|
|
|
to
|
to
|
to
|
|
Line of Busines
|
June 30,
2020
|
June 30,
2019
|
June 30,
2018
|
|
|
|
|
|
|
Personal Lines:
|
|
|
|
|
Homeowners,
dwelling fire and canine legal liability
|
|
|
|
|
Quota
share treaty:
|
|
|
|
|
Percent
ceded
|
None
|
10%
|
20%
|
|
Risk
retained
|
$1,000,000
|
$900,000
|
$800,000
|
|
Losses
per occurrence subject to quota share reinsurance
coverage
|
None
|
$1,000,000
|
$1,000,000
|
|
Excess
of loss coverage and facultative facility above quota share
coverage (1)
|
$10,000,000
|
$9,000,000
|
$9,000,000
|
|
|
|
in excess of
|
in
excess of
|
|
|
$1,000,000
|
$1,000,000
|
|
|
Total
reinsurance coverage per occurrence
|
$9,000,000
|
$9,100,000
|
$9,200,000
|
|
Losses
per occurrence subject to reinsurance coverage
|
$10,000,000
|
$10,000,000
|
$10,000,000
|
|
Expiration
date
|
June 30, 2020
|
June 30, 2019
|
June 30, 2018
|
|
|
|
|
|
|
Personal
Umbrella
|
|
|
|
|
Quota
share treaty:
|
|
|
|
|
Percent
ceded - first $1,000,000 of coverage
|
90%
|
90%
|
90%
|
|
Percent
ceded - excess of $1,000,000 dollars of coverage
|
100%
|
100%
|
100%
|
|
Risk
retained
|
$100,000
|
$100,000
|
$100,000
|
|
Total
reinsurance coverage per occurrence
|
$4,900,000
|
$4,900,000
|
$4,900,000
|
|
Losses
per occurrence subject to quota share reinsurance
coverage
|
$5,000,000
|
$5,000,000
|
$5,000,000
|
|
Expiration
date
|
June 30, 2020
|
June 30, 2019
|
June 30, 2018
|
|
|
|
|
|
|
Commercial Lines:
|
|
|
|
|
General
liability commercial policies
|
|
|
|
|
Quota
share treaty
|
None
|
None
|
None
|
|
Risk
retained
|
$750,000
|
$750,000
|
$750,000
|
|
Excess
of loss coverage above risk retained
|
$3,750,000
|
$3,750,000
|
$3,750,000
|
|
|
in excess of
|
in excess of
|
in excess of
|
|
|
$750,000
|
$750,000
|
$750,000
|
|
Total
reinsurance coverage per occurrence
|
$3,750,000
|
$3,750,000
|
$3,750,000
|
|
Losses
per occurrence subject to reinsurance coverage
|
$4,500,000
|
$4,500,000
|
$4,500,000
|
|
|
|
|
|
|
Commercial
Umbrella
|
|
|
|
|
Quota
share treaty:
|
None
|
|
|
|
Percent
ceded - first $1,000,000 of coverage
|
|
90%
|
90%
|
|
Percent
ceded - excess of $1,000,000 of coverage
|
|
100%
|
100%
|
|
Risk
retained
|
|
$100,000
|
$100,000
|
|
Total
reinsurance coverage per occurrence
|
|
$4,900,000
|
$4,900,000
|
|
Losses
per occurrence subject to quota share reinsurance
coverage
|
|
$5,000,000
|
$5,000,000
|
|
Expiration
date
|
|
June 30, 2019
|
June 30, 2018
|
|
|
|
|
|
|
Catastrophe Reinsurance:
|
|
|
|
|
Initial
loss subject to personal lines quota share treaty
|
None
|
$5,000,000
|
$5,000,000
|
|
Risk
retained per catastrophe occurrence (2)
|
$7,500,000
|
$4,500,000
|
$4,000,000
|
|
Catastrophe
loss coverage in excess of quota share coverage (3)
|
$602,500,000
|
$445,000,000
|
$315,000,000
|
|
Reinstatement
premium protection (4)(5)(6)
|
Yes
|
Yes
|
Yes
|
(1)
For
personal lines, includes the addition of an automatic facultative
facility allowing KICO to obtain homeowners single risk coverage up
to $10,000,000 in total insured value, which covers direct losses
from $3,500,000 to $10,000,000.
(2)
Plus
losses in excess of catastrophe coverage.
(3)
Catastrophe
coverage is limited on an annual basis to two times the per
occurrence amounts. Duration of 168
consecutive hours for a catastrophe occurrence from windstorm,
hail, tornado, hurricane, and cyclone.
(4)
Effective
July 1, 2017, reinstatement premium protection for $145,000,000 of
catastrophe coverage in excess of $5,000,000..
Effective July 1,
2018, reinstatement premium protection for $210,000,000 of
catastrophe coverage in excess of $5,000,000.
64
Effective
July 1, 2019, reinstatement premium protection for $292,500,000 of
catastrophe coverage in excess of $7,500,000.
The
single maximum risks per occurrence to which the Company is subject
under the treaty year shown below is as follows:
|
|
July 1, 2019 - June 30, 2020
|
|
|
Treaty
|
Range of Loss
|
Risk Retained
|
| Personal Lines (1) |
Initial $1,000,000
|
$1,000,000
|
|
|
$1,000,000 - $10,000,000
|
None(2)
|
|
|
Over $10,000,000
|
100%
|
|
|
|
|
|
Personal Umbrella
|
Initial $1,000,000
|
$100,000
|
|
|
$1,000,000 - $5,000,000
|
None
|
|
|
Over $5,000,000
|
100%
|
|
|
|
|
|
Commercial Lines
|
Initial $750,000
|
$750,000
|
|
|
$750,000 - $4,500,000
|
None(3)
|
|
|
Over $4,500,000
|
100%
|
|
|
|
|
|
Catastrophe (4)
|
Initial $7,500,000
|
$7,500,000
|
|
|
$7,500,000 - $610,000,000
|
None
|
|
|
Over $610,000,000
|
100%
|
(1)
Personal
lines quota share treaty was eliminated effective July 1, 2019. The
2017/2019 Treaty expired on a run-off basis.
(2)
Covered
by excess of loss treaties up to $3,500,000 and by facultative
facility from $3,500,000 to $10,000,000.
(3)
Covered by excess
of loss treaties.
(4)
Catastrophe
coverage is limited on an annual basis to two times the per
occurrence amounts.
The
single maximum risks per occurrence to which the Company is subject
under the treaty years shown below are as follows:
|
|
July 1, 2018 - June 30, 2019
|
|
July 1, 2017 - June 30, 2018
|
||
|
Treaty
|
Range of Loss
|
Risk Retained
|
Range of Loss
|
Risk Retained
|
|
|
Personal Lines (1)
|
Initial $1,000,000
|
$900,000
|
|
Initial $1,000,000
|
$800,000
|
|
|
$1,000,000 - $10,000,000
|
None(2)
|
|
$1,000,000 - $10,000,000
|
None(2)
|
|
|
Over $10,000,000
|
100%
|
|
Over $10,000,000
|
100%
|
|
|
|
|
|
|
|
|
Personal Umbrella
|
Initial $1,000,000
|
$100,000
|
|
Initial $1,000,000
|
$100,000
|
|
|
$1,000,000 - $5,000,000
|
None
|
|
$1,000,000 - $5,000,000
|
None
|
|
|
Over $5,000,000
|
100%
|
|
Over $5,000,000
|
100%
|
|
|
|
|
|
|
|
|
Commercial Lines
|
Initial $750,000
|
$750,000
|
|
Initial $750,000
|
$750,000
|
|
|
$750,000 - $4,500,000
|
None(3)
|
|
$750,000 - $4,500,000
|
None(3)
|
|
|
Over $4,500,000
|
100%
|
|
Over $4,500,000
|
100%
|
|
|
|
|
|
|
|
|
Commercial Umbrella
|
Initial $1,000,000
|
$100,000
|
|
Initial $1,000,000
|
$100,000
|
|
|
$1,000,000 - $5,000,000
|
None
|
|
$1,000,000 - $5,000,000
|
None
|
|
|
Over $5,000,000
|
100%
|
|
Over $5,000,000
|
100%
|
|
|
|
|
|
|
|
|
Catastrophe (4)
|
Initial $5,000,000
|
$4,500,000
|
|
Initial $5,000,000
|
$4,000,000
|
|
|
$5,000,000 - $450,000,000
|
None
|
|
$5,000,000 - $320,000,000
|
None
|
|
|
Over $450,000,000
|
100%
|
|
Over $320,000,000
|
100%
|
(1)
Treaty
for July 1, 2017 – June 30, 2018 and July 1, 2018 –
June 30, 2019 is a two-year treaty with expiration date of June 30,
2019.
(2)
Covered
by excess of loss treaties up to $3,500,000 and by facultative
facility from $3,500,000 to $10,000,000.
(3)
Covered by excess
of loss treaties.
(4)
Catastrophe
coverage is limited on an annual basis to two times the per
occurrence amounts.
Off-Balance Sheet Arrangements
We have
no off-balance sheet arrangements that have or are reasonably
likely to have a current or future effect on our financial
condition, changes in financial condition, revenues or expenses,
results of operations, liquidity, capital expenditures or capital
resources that is material to investors.
65
Item 3. Quantitative and
Qualitative Disclosures About Market Risk.
This
item is not applicable to smaller reporting companies.
Item 4. Controls and
Procedures.
Evaluation of Disclosure Controls and Procedures
We
maintain a system of disclosure controls and procedures as defined
in Rule 13a-15(e) under the Exchange Act that are designed to
assure that information required to be disclosed in the reports we
file or submit under the Exchange Act is recorded, processed,
summarized and reported within the time periods specified in the
SEC’s rules and forms, and that such information is
accumulated and communicated to management, including our Chief
Executive Officer and Chief Financial Officer, as appropriate, to
allow timely decisions regarding required disclosures. Based on
this evaluation, our Chief Executive Officer and Chief Financial
Officer have concluded that, as of the end of such period, our
disclosure controls and procedures were: (i) not effective as of
September 30, 2019 as a result of the material weakness identified
in the quarter in recording, processing, summarizing, and reporting
information on a timely basis that we are required to disclose in
the reports that we file or submit under the Exchange Act, and (ii)
not effective as of September 30,
2019 in ensuring that information that we are required to
disclose in the reports that we file or submit under the Exchange
Act is accumulated and communicated to our management, including
our Chief Executive Officer and Chief Financial Officer, as
appropriate, to allow timely decisions regarding required
disclosure.
As
required by Exchange Act Rule 13a-15(b), as of the end of the
period covered by this Quarterly Report, under the supervision and
with the participation of our Chief Executive Officer and Chief
Financial Officer, we evaluated the effectiveness of our disclosure
controls and procedures. Our management concluded that, as of
September 30, 2019, our internal control over financial reporting
was not effective. Management determined there was ineffective
oversight over the process of setting appropriate liability case
reserves, which has been assessed as a material weakness. Case
reserve estimates are subject to individual judgment, and provide
the primary information used as the basis for setting overall
reserve levels including a provision for IBNR reserves.
Notwithstanding the material weakness, management has concluded
that the accompanying condensed consolidated financial statements
included in this Form 10-Q fairly present, in all material
respects, the financial position, results of operations, and cash
flows for the periods presented in accordance with U.S. generally
accepted accounting principles.
A
material weakness is a deficiency, or combination of deficiencies,
in internal control over financial reporting such that there is a
reasonable possibility that a material misstatement of an entity's
financial statements will not be prevented or detected and
corrected on a timely basis.
Identification of the Material Weakness in Internal Control over
Financial Reporting
During
our assessment we determined that the following material weaknesses
existed as of September, 30, 2019 in the principles associated with
both the control and monitoring activity components of the COSO
framework:
The
material weakness relates to the ineffective oversight over the
establishment of case reserve levels, as discussed above. As of the
date of this report, there have been no misstatements identified.
Insurance loss reserving is an inherently judgmental process. It is
dependent on individual opinions regarding specific information
available at a given point in time. Recent reviews of our claims
reserving process by multiple parties have led to the additional
increase in reserves taken this quarter.
Remediation Plans
Our
management, with oversight from our Audit Committee, will initiate
a plan to remediate the material weakness above. Management will
work to ensure that all designed control activities are executed
appropriately for the remainder of 2019. Management believes that
such activities will allow the Company to select, develop, and
perform ongoing and/or separate evaluations to ascertain whether
our components of internal control are present and functioning.
Because the reliability of the internal control process requires
repeatable execution, the material
weakness cannot be considered fully remediated
until all remedial processes and procedures have been implemented,
each applicable control has operated for a sufficient period of
time, and management has concluded, through testing, that the
controls are operating effectively. Until the material weakness is
remediated, we will not be able to assert that our internal
controls are effective.
Changes in Internal Control over Financial Reporting
There
was no change in our internal control over financial reporting
during our most recently completed fiscal quarter that has
materially affected, or is reasonably likely to materially affect,
our internal control over financial reporting.
66
PART II. OTHER INFORMATION
Item 1. Legal
Proceedings.
On June
12, 2019, Phillip Woolgar filed a suit naming the Company and
certain present or former officers and directors as defendants in a
putative class action captioned Woolgar v. Kingstone Companies et al.,
19 cv 05500 (S.D.N.Y.), asserting claims under Section 10(b) of the
Exchange Act and SEC Rule 10b-5 promulgated thereunder and Section
20(a) of the Exchange Act. Plaintiff seeks to represent a
class of persons or entities that purchased Kingstone securities
between March 14, 2018, and April 29, 2019, and alleges violations
of the federal securities law in connection with the
Company’s April 29, 2019 announcement regarding losses
related to winter catastrophe events. The lawsuit alleges
that the Company failed to disclose that it did not adequately
follow industry best practices related to claims handling and thus
did not record sufficient claim reserves, and that as a result,
Defendants’ positive statements about the Company’s
business, operations and prospects misled investors.
Plaintiff seeks, among other things, an undetermined amount of
money damages. We believe the lawsuit to be without
merit.
Item 1A. Risk
Factors.
There
have been no material changes from the risk factors previously
disclosed in Part I Item 1A of our Annual Report on Form 10-K for
the year ended December 31, 2018 except for the
following:
Our failure to implement and maintain adequate internal controls
over financial reporting in our business could have a material
adverse effect on our business, financial condition, results of
operations and stock price.
"Internal controls
over financial reporting" refer to those procedures within a
company that are designed to reasonably ensure the accuracy of the
company's financial statements. Section 404 of the Sarbanes-Oxley
Act of 2002 requires our management to annually assess the
effectiveness of our internal controls over financial
reporting.
As discussed in
Part I, Item 4 of this Form 10-Q, we have determined that, as of
September 30, 2019, a material weakness in internal control over
financial reporting existed with regard to the process surrounding
the establishment of case reserve levels. We will initiate a plan
to remedy the material weakness in order that all design control
activities are executed appropriately for the remainder of
2019.
If we
fail to achieve and maintain adequate internal controls, or if we
have material weaknesses in our internal controls, in each case in
accordance with applicable standards, we may be unable to conclude
on an ongoing basis that we have effective internal controls over
financial reporting in accordance with Section 404. Because
effective internal controls are necessary for us to produce
reliable financial reports, our business, financial condition and
results of operations could be harmed, investors could lose
confidence in our reported financial information, and the market
price for our stock could decline if our internal controls are
ineffective or if material weaknesses in our internal controls are
identified.
Item 2. Unregistered Sales
of Equity Securities and Use of Proceeds.
(a) None.
(b) Not
applicable.
(c) There were
no purchases of common stock made by us or any “affiliated
purchaser” during the quarter ended September 30,
2019.
Item 3. Defaults Upon
Senior Securities.
None.
Item 4. Mine Safety
Disclosures.
Not
applicable.
Item 5. Other
Information.
None.
67
Item 6. Exhibits.
|
3(a)
|
Restated
Certificate of Incorporation, as amended (incorporated by reference
to Exhibit 3(a) to the Company’s Quarterly Report on Form
10-Q for the period ended March 31, 2014 filed on May 15,
2014).
|
|
|
|
|
3(b)
|
By-laws,
as amended (incorporated by reference to Exhibit 3.1 to the
Company’s Current Report on Form 8-K filed on November 9,
2009).
|
|
|
|
|
10(a)
|
Agreement
and General Release, dated as of July 19, 2019, by and among
Kingstone Companies, Inc., Kingstone Insurance Company and Dale A.
Thatcher (incorporated by reference to Exhibit 10.1 to the
Company’s Current Report on Form 8-K filed on July 19,
2019).
|
|
|
|
|
10(b)
|
Employment
Agreement, dated as of August 27, 2019, by and between Kingstone
Companies, Inc., and Meryl S. Golden (incorporated by reference to
Exhibit 99.1 to the Company’s Current Report on Form 8-K
filed on September 17, 2019).
|
|
|
|
|
Rule
13a-14(a)/15d-14(a) Certification of Principal Executive Officer as
adopted pursuant to Section 302 of the Sarbanes-Oxley Act of
2002
|
|
|
|
|
|
Rule
13a-14(a)/15d-14(a) Certification of Principal Financial Officer as
adopted pursuant to Section 302 of the Sarbanes-Oxley Act of
2002
|
|
|
|
|
|
Certification
of Chief Executive Officer and Chief Financial Officer Pursuant to
18 U.S.C. Section 1350, as Adopted Pursuant to Section 906 of the
Sarbanes-Oxley Act of 2002
|
|
|
|
|
|
101.INS
|
XBRL
Instance Document
|
|
|
|
|
101.SCH
|
101.SCH
XBRL Taxonomy Extension Schema.
|
|
|
|
|
101.CAL
|
101.CAL
XBRL Taxonomy Extension Calculation Linkbase.
|
|
|
|
|
101.DEF
|
101.DEF
XBRL Taxonomy Extension Definition Linkbase.
|
|
|
|
|
101.LAB
|
101.LAB
XBRL Taxonomy Extension Label Linkbase.
|
|
|
|
|
101.PRE
|
101.PRE
XBRL Taxonomy Extension Presentation Linkbase.
|
|
+
|
This
exhibit will not be deemed “filed” for purposes of
Section 18 of the Securities Exchange Act of 1934, as amended, or
otherwise subject to the liability of that section. Such exhibit
shall not be deemed incorporated into any filing under the
Securities Act of 1933, as amended, or the Securities Act of 1934,
as amended.
|
68
SIGNATURES
Pursuant to the
requirements of the Securities Exchange Act of 1934, the registrant
has duly caused this report to be signed on its behalf by the
undersigned thereunto duly authorized.
|
|
KINGSTONE
COMPANIES, INC.
|
|
|
|
|
|
|
|
|
Date: November 12,
2019
|
By:
|
/s/ Barry B.
Goldstein
|
|
|
|
|
Barry B. Goldstein |
|
|
|
|
Chief Executive Officer |
|
|
|
|
||
|
|
|
|
|
|
Date: November 12,
2019
|
By:
|
/s/ Victor
Brodsky
|
|
|
|
|
Victor
Brodsky
|
|
|
|
|
Chief Financial
Officer
|
|
69
Exhibit 31(a)
CERTIFICATION
|
I,
Barry B. Goldstein, certify that:
|
||
|
|
|
|
|
1.
|
I have
reviewed this Quarterly Report on Form 10-Q of Kingstone Companies,
Inc.;
|
|
|
|
|
|
|
2.
|
Based
on my knowledge, this report does not contain any untrue statement
of a material fact or omit to state a material fact necessary to
make the statements made, in light of the circumstances under which
such statements were made, not misleading with respect to the
period covered by this report;
|
|
|
|
|
|
|
3.
|
Based
on my knowledge, the financial statements, and other financial
information included in this report, fairly present in all material
respects the financial condition, results of operations and cash
flows of the registrant as of, and for, the periods presented in
this report;
|
|
|
|
|
|
|
4.
|
The
registrant’s other certifying officer and I are responsible
for establishing and maintaining disclosure controls and procedures
(as defined in Exchange Act Rules 13a-15(e) and 15d-15(e)) and
internal control over financial reporting (as defined in Exchange
Act Rules 13a-15(f) and 15d-15(f)) for the registrant and
have:
|
|
|
|
|
|
|
|
(a)
|
Designed
such disclosure controls and procedures, or caused such disclosure
controls and procedures to be designed under our supervision, to
ensure that material information relating to the registrant,
including its consolidated subsidiaries, is made known to us by
others within those entities, particularly during the period in
which this report is being prepared;
|
|
|
|
|
|
|
(b)
|
Designed
such internal control over financial reporting, or caused such
internal control over financial reporting to be designed under our
supervision, to provide reasonable assurance regarding the
reliability of financial reporting and the preparation of financial
statements for external purposes in accordance with generally
accepted accounting principles;
|
|
|
|
|
|
|
(c)
|
Evaluated
the effectiveness of the registrant’s disclosure controls and
procedures and presented in this report our conclusions about the
effectiveness of the disclosure controls and procedures, as of the
end of the period covered by this report based on such evaluation;
and
|
|
|
|
|
|
|
(d)
|
Disclosed
in this report any change in the registrant’s internal
control over financial reporting that occurred during the
registrant’s most recent fiscal quarter (the
registrant’s fourth fiscal quarter in the case of an annual
report) that has materially affected, or is reasonably likely to
materially affect, the registrant’s internal control over
financial reporting; and
|
|
|
|
|
|
5.
|
The
registrant’s other certifying officer and I have disclosed,
based on our most recent evaluation of internal control over
financial reporting, to the registrant’s auditors and the
audit committee of the registrant’s board of directors (or
persons performing the equivalent functions):
|
|
|
|
|
|
|
|
(a)
|
All
significant deficiencies and material weaknesses in the design or
operation of internal control over financial reporting which are
reasonably likely to adversely affect the registrant’s
ability to record, process, summarize and report financial
information; and
|
|
|
|
|
|
|
(b)
|
Any
fraud, whether or not material, that involves management or other
employees who have a significant role in the registrant’s
internal control over financial reporting.
|
|
Date:
November 12, 2019
|
|
|
|
/s/ Barry B. Goldstein
|
|
|
Barry
B. Goldstein
Chief
Executive Officer
|
Exhibit 31(b)
CERTIFICATION
|
I,
Victor Brodsky, certify that:
|
||
|
|
|
|
|
1.
|
I have
reviewed this Quarterly Report on Form 10-Q of Kingstone Companies,
Inc.;
|
|
|
|
|
|
|
2.
|
Based
on my knowledge, this report does not contain any untrue statement
of a material fact or omit to state a material fact necessary to
make the statements made, in light of the circumstances under which
such statements were made, not misleading with respect to the
period covered by this report;
|
|
|
|
|
|
|
3.
|
Based
on my knowledge, the financial statements, and other financial
information included in this report, fairly present in all material
respects the financial condition, results of operations and cash
flows of the registrant as of, and for, the periods presented in
this report;
|
|
|
|
|
|
|
4.
|
The
registrant’s other certifying officer and I are responsible
for establishing and maintaining disclosure controls and procedures
(as defined in Exchange Act Rules 13a-15(e) and 15d-15(e)) and
internal control over financial reporting (as defined in Exchange
Act Rules 13a-15(f) and 15d-15(f)) for the registrant and
have:
|
|
|
|
|
|
|
|
(a)
|
Designed
such disclosure controls and procedures, or caused such disclosure
controls and procedures to be designed under our supervision, to
ensure that material information relating to the registrant,
including its consolidated subsidiaries, is made known to us by
others within those entities, particularly during the period in
which this report is being prepared;
|
|
|
|
|
|
|
(b)
|
Designed
such internal control over financial reporting, or caused such
internal control over financial reporting to be designed under our
supervision, to provide reasonable assurance regarding the
reliability of financial reporting and the preparation of financial
statements for external purposes in accordance with generally
accepted accounting principles;
|
|
|
|
|
|
|
(c)
|
Evaluated
the effectiveness of the registrant’s disclosure controls and
procedures and presented in this report our conclusions about the
effectiveness of the disclosure controls and procedures, as of the
end of the period covered by this report based on such evaluation;
and
|
|
|
|
|
|
|
(d)
|
Disclosed
in this report any change in the registrant’s internal
control over financial reporting that occurred during the
registrant’s most recent fiscal quarter (the
registrant’s fourth fiscal quarter in the case of an annual
report) that has materially affected, or is reasonably likely to
materially affect, the registrant’s internal control over
financial reporting; and
|
|
|
|
|
|
5.
|
The
registrant’s other certifying officer and I have disclosed,
based on our most recent evaluation of internal control over
financial reporting, to the registrant’s auditors and the
audit committee of the registrant’s board of directors (or
persons performing the equivalent functions):
|
|
|
|
|
|
|
|
(a)
|
All
significant deficiencies and material weaknesses in the design or
operation of internal control over financial reporting which are
reasonably likely to adversely affect the registrant’s
ability to record, process, summarize and report financial
information; and
|
|
|
|
|
|
|
(b)
|
Any
fraud, whether or not material, that involves management or other
employees who have a significant role in the registrant’s
internal control over financial reporting.
|
|
Date:
November 12, 2019
|
|
|
|
/s/ Victor Brodsky
|
|
|
Victor
Brodsky
Chief
Financial Officer
|
Exhibit 32
CERTIFICATION OF CHIEF EXECUTIVE OFFICER
AND CHIEF FINANCIAL OFFICER
PURSUANT TO
18 U.S.C. SECTION 1350,
AS ADOPTED PURSUANT TO
SECTION 906 OF THE SARBANES-OXLEY ACT OF 2002
The
undersigned hereby certify, pursuant to, and as required by, 18
U.S.C. Section 1350, as adopted pursuant to Section 906 of the
Sarbanes-Oxley Act of 2002, that the Quarterly Report of Kingstone
Companies, Inc. (the “Company”) on Form 10-Q for the
period ended September 30, 2019 fully complies with the requirements
of Section 13(a) or 15(d) of the Securities Exchange Act of 1934,
as amended, and that information contained in such Quarterly Report
on Form 10-Q fairly presents, in all material respects, the
financial condition and results of operations of the
Company.
Dated: November 12,
2019
/s/ Barry B.
Goldstein
Barry
B. Goldstein
Chief
Executive Officer
/s/ Victor Brodsky
Victor
Brodsky
Chief
Financial Officer